CryptoAcademy Season 3 Week 5 | Homework Post for Professor @lenonmc21 | Trade with "Simple and Exponential Moving Averages" + application of "Fibonacci Retracements. By @vibrant6689


Q(1)DEFINE IN YOUR OWN WORDS, WHAT ARE "SIMPLE MOVING AVERAGES" AND "EXPONENTIAL MOVING AVERAGES"
SIMPLE MOVING AVERAGES
The Simple Moving Averages also known as trend indicator are very important technical instruments which are useful in determining the price trend for a given time frame by traders/ financial analyst.
It can also be used to predict a possible direction of an asset.
It is used for calculating an asset average closing price over a given time frame.
SMAs is shown as a line on a chart.
Asset most likely support & resistance can also be determined using the SMAs.
EXPONENTIAL MOVING AVERAGES
The EMAs are another kind of indicator that still serves a very great purpose to a trader just like the simple moving averages, though with little distinction.
EMAs is distinct from SMAs in the sense that it lays more of its weight and interest on the recent price Unlike SMAs that distribute weight evenly to all values. This gives it an added advantage or upper hand over the SMAs since it reacts faster to price changes than the SMAs.
Q(2) EXPLAIN HOW SIMPLE MOVING AVERAGES AND EXPONENTIAL MOVING AVERAGES ARE CALCULATED.
HOW TO CALCULATE SIMPLE MOVING AVERAGES
Calculating SMAs is very simple, hence, is done by the summation of all the closing market price over a given time frame and the resultant figure is divided by the total number of hours or days, depending.
For instance; let's calculate SMA of a security over a period of 5 days With These closing prices. (20, 22, 24, 25, 23). The formula below is used,
FORMULA
SMA = A1 + A2 + ... + An / n
where: "An" ........ stands for (the price of an asset at period n) and
...... n stands for the number of full period
Substitution;
SMA = 20 + 22 + 24 + 25 + 23/5
SMA = 114/5
SMA = 22.8
:• The SMA of a security over a time frame of 5 days is 22.8
HOW TO CALCULATE EXPONENTIAL MOVING AVERAGES
In calculating the EMA, we will add the current closing price with the recent value of the SMA.
Using 3 steps [Calculate the SMA] + [Calculate the multiplier of the EMA] = [calculate the Current EMA]
The formula below is used;
EMA = [(PRICE today x SMA weighted average) + (EMAyesterday.)]
At the end you will find out that the previous data will disappear upon the inclusion of new prices. Hence, the reason EMA is observed to prioritize trade's most recent and current price.
Q(3) BRIEFLY DESCRIBE ATLEAST 2 WAYS TO USE THEM IN OUR TRADING OPERATIONS
USES SMA and EMA IN OUR TRADING OPERATIONS
- Studying the crosses
Good knowledge of the golden and dead cross will help a trader to know the most likely buy or sell signal. For instance; a signal will be marked to inform a trader that the cross is above the moving averages. This is a signal for possible buy. While in the hand, of the cross overdrops below the moving averages, it signals sell.
- Identification of Support cum Resistance
The SMAs and EMAs can be of a very great help to a financial analyst or a trader to determine or identify the two major important zones which are Support cum resistance.
This as a result will now give traders useful insight for professional trading.
- Identify market bias
They can also be used to identify the overall market bias of an asset over a period of time.
- Determination of market direction or trend
Traders can use these indicators to ascertain the market trend by simply adding them together to extract an end of a move, whether it is bullish or bearish.
Hence, at a point, the SMAs and EMAs would converge. This point of convergence is known as Golden Rule thus, traders explore this point for their benefits as explained above.
Q(4) WHAT IS THE DIFFERENCE BETWEEN SIMPLE MOVING AVERAGES AND EXPONENTIAL MOVING AVERAGES? (Explain in detail).
| SIMPLE MOVING AVERAGES | EXPONENTIAL MOVING AVERAGES |
|---|---|
| Fake market move. I.e, assuming SMAs is calculating for ten days closing price, then 1 out of the ten days witnessed a massive spike. This moves some times doesn't give accurate answer when the total number of days are added, but the SMAs still calculates it that way, thus, that might likely cause a distortion in the market move. | gives more accurate answer and as such, eliminate the shortcomings of the SMAs. |
| Does not consider recent price movement | prioritizes the recent price movement. |
| Very slow in responding to price changes | responds to price changes very fast. |
| Distribute equal weight to all values | gives higher weight to recent prices. |
(5)DEFINE AND EXPLAIN IN YOUR OWN WORDS, WHAT "FIBONACCI RETRACEMENTS" ARE AND WHAT THEIR GOLD RATIOS ARE
FIBONACCI RETRACEMENTS
This is a technical instrument which constitute a series of numbers used to calculate the most likely upcoming market reversals or correction after a strong impulse.
These are horizontal lines which displays a feasible Support cum Resistance zone.
GOLD RATIOS OF FIBONACCI RETRACEMENTS
This is a concept that was founded by Leonardo Pisano. A mathematician who heads from Italy.
To get the sequence numbers of Fibonacci, you add the previous two numbers. For instance, unlike natural number sequence that ascends up gradually by plus 1. That is 0, 1, 2, 3, etc, the Fibonacci sequence gets its number by the addition of the number before to the number after. This continues progressively in the ascending order, that is, 0+1,=1, then 1+1 = 2 and 1+2=3. The sequence would be like this.....
0,1,1,2,3,5,8,13,21,34.... And so on.
Now to get the Fibonacci replacement ratio, you divide the number before by the number after. Just like the Fibonacci sequence, only that this one is division. For example;
0÷1 =0,
1÷1 = 1
1÷2 =0.5
1÷3 = 0.333
2÷3 = 0.666
3÷5 =0.6
3÷8= 0.375
5÷8 =0.625
5÷13= 0.384
8÷21 = 0.380
13÷34= 0.382, And the list goes on and on.
The above is known as fibonacci retracement ratio.
However, among these ratios, 38.2%, 50%, 61.8%, 76.8% are considered the most important and they are the ones traders make use of. Then the golden ratio is 61.8% or 0.618
At 50% is considered the center of equilibrium
Among these numbers, thus, whenever price comes to 50%, it sends the information that buyers price and sellers price is at equilibrium. Traders believe that, when price comes to 50%, the price is at equilibrium.
As pointed earlier, the application of Fibonacci retracements in trading is very pertinent for calculating or measuring upcoming corrections (retracements) with respect to it's price at a given time period and in any trend direction, either rise or fall. In other words, this implies that the price correction can be spotted on the resistance and support zone.
Hence, to apply Fibonacci retracements in the bullish or uptrend, the below guide line is used...
FOR UPTREND
Applying Fibonacci Retracements for an uptrend, you draw a slope from the lowest point to the highest point, take note of the swings.
The swing helps in determining the level that is more prone to price correction and then, acquiring informations as regards to what extent the price can go before furthering it's recent upward movement.
FOR DOWNTREND
Same thing you did in the uptrend is what you would still do in the downtrend, that is, drawing of line, just that in this case, the line is draw in the opposite of what was done in the uptrend, thus, the Fibonacci tool is used to draw a slope from the highest point to the lowest point, also taking note of the swing which determines, consequently, the possible of price correction upward and extracting the informations as to what extent the price might likely go back to later further with it's recent downward movement.
PRACTICE (only use your own images)
- SHOW STEP BY STEP HOW TO ADD A "SIMPLE AND EXPONENTIAL MOVING AVERAGES"TO THE GRAPH (only your own screenshots - Nothing taken from the web).
ADDING SIMPLE MOVING AVERAGES
I will use my MT4 application for this task. thus, to add a simple moving averages to the graph, the following steps are;
⏩ 1
I will locate the MT4 app on my phone and explore it by clicking on it.
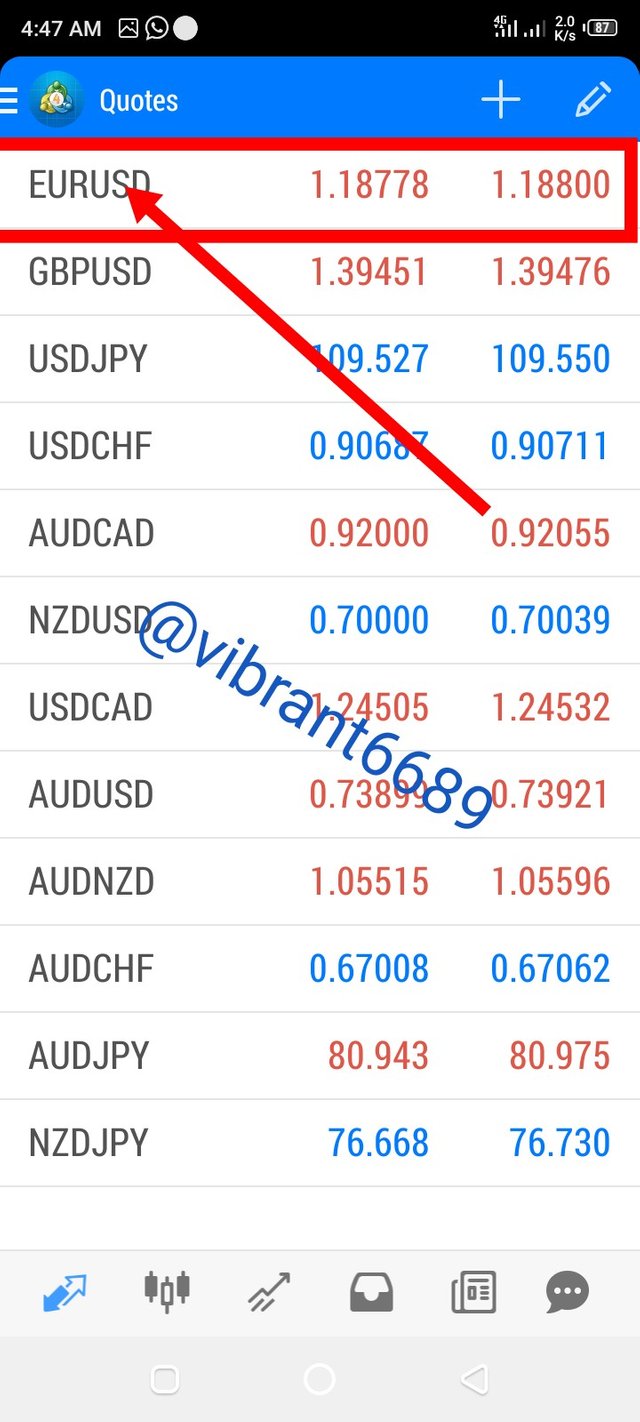
⏩ 2
When it opens, you now select the pair that you desire to analyze or add MA. My choice here is EURUSD
⏩3
Select open chart from the option that would be displayed, when it opened, I discovered that it was showing only the chart without any line. Therefore, for me to add the moving averages, I clicked on the indicator icon(f) at the top.
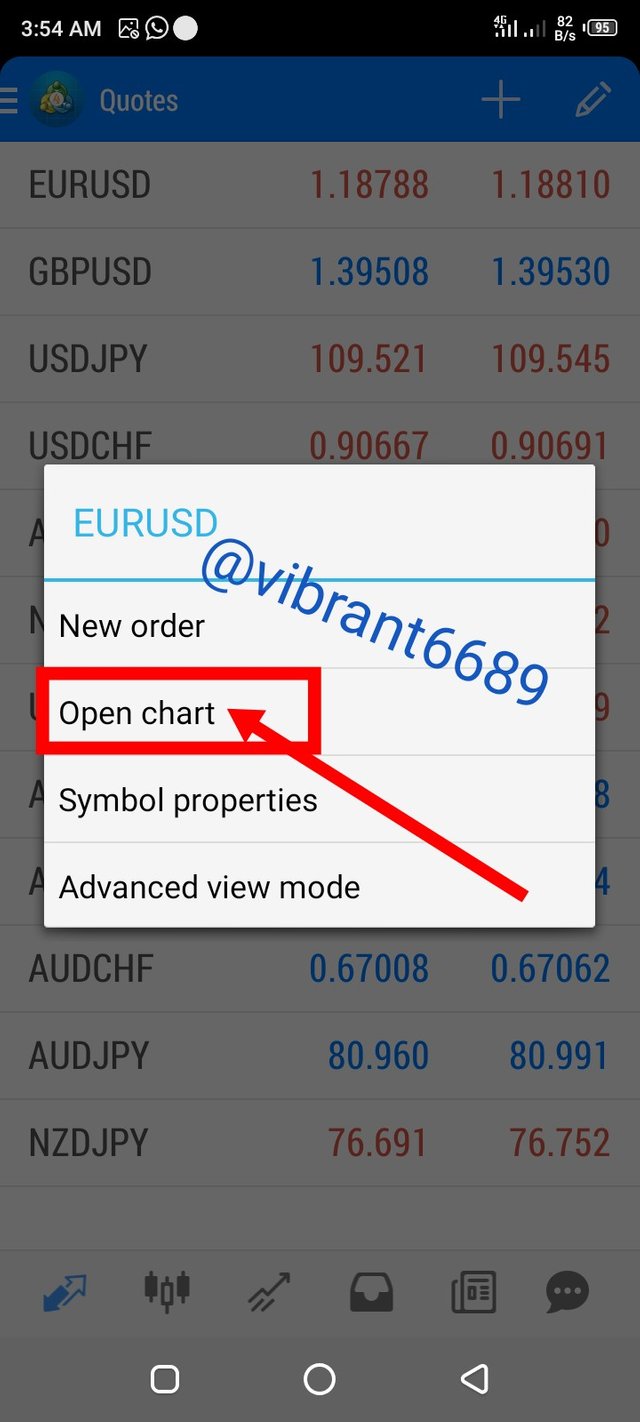
Select open chart
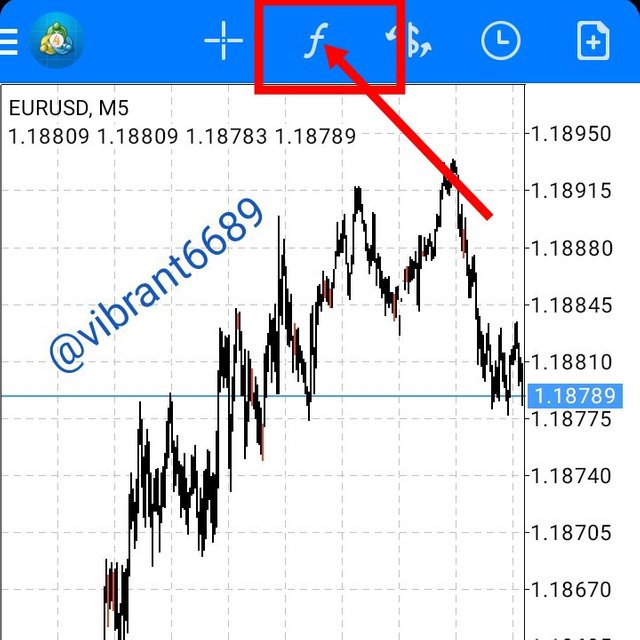
Click on the indicator
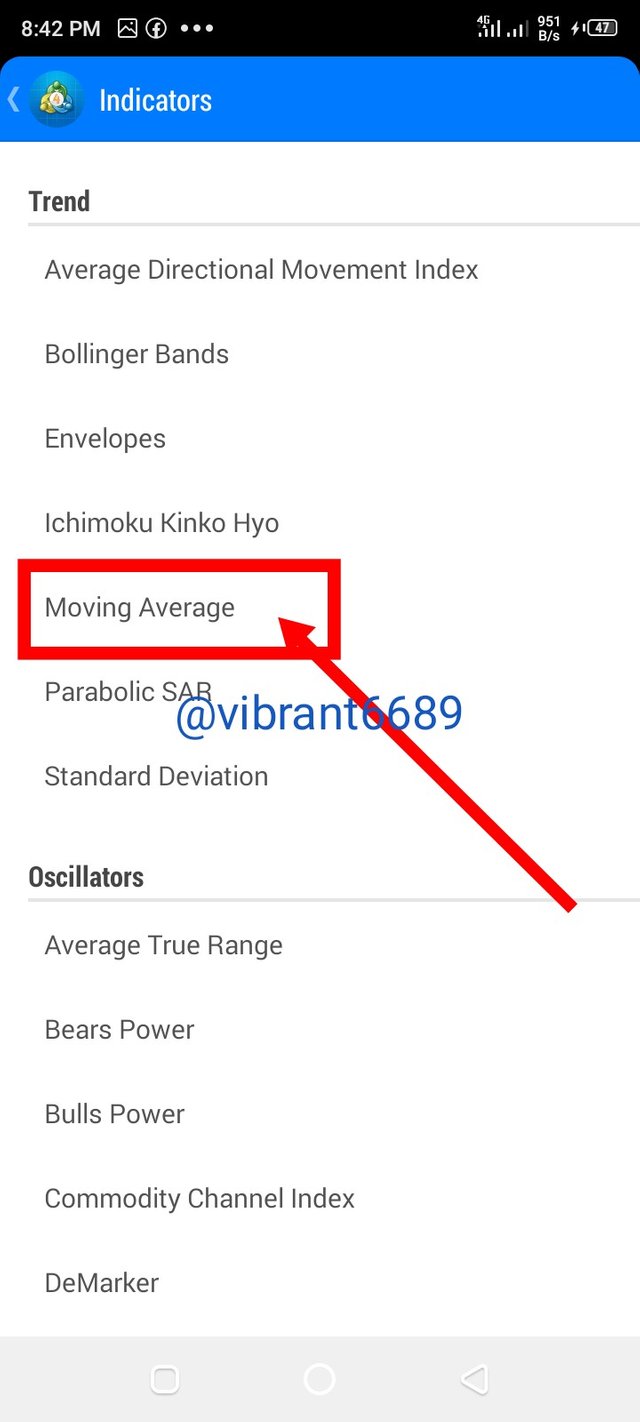
⏩ 4
This page that opens contains list of different indicators. Since we are interested in moving average, we click on it.
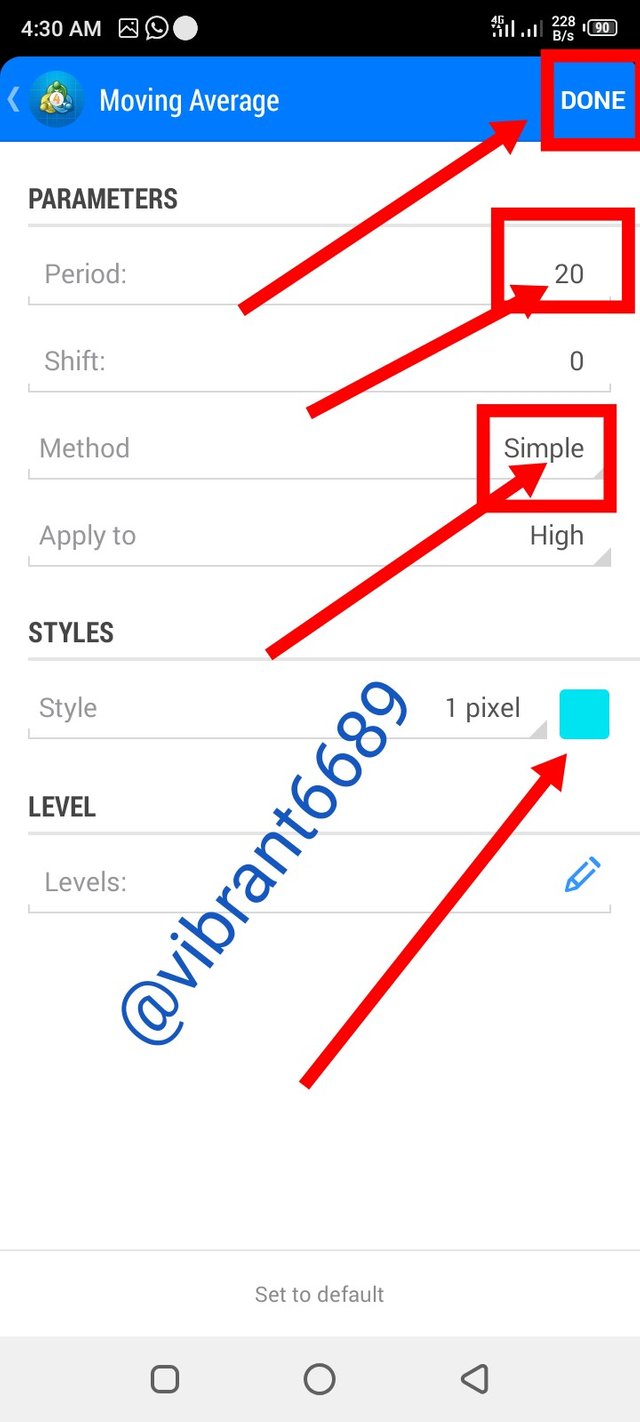
⏩ 5
The next page that will open is more like an open cheque, hence you will edit to put the changes you require. For example; I want to add 20 moving averages.
- I added it at the space that is written period.
Then, because I'm going for simple moving averages,
I added in the space showing method.
Optionally, you can decide to change the color of the indicator line you want to add by editing it on the space that is written style.
- Then after you have finished editing, you click on done as seen in the first marker
What you will do next is to go back to chart and check if the changes were effected. You will see something like this...
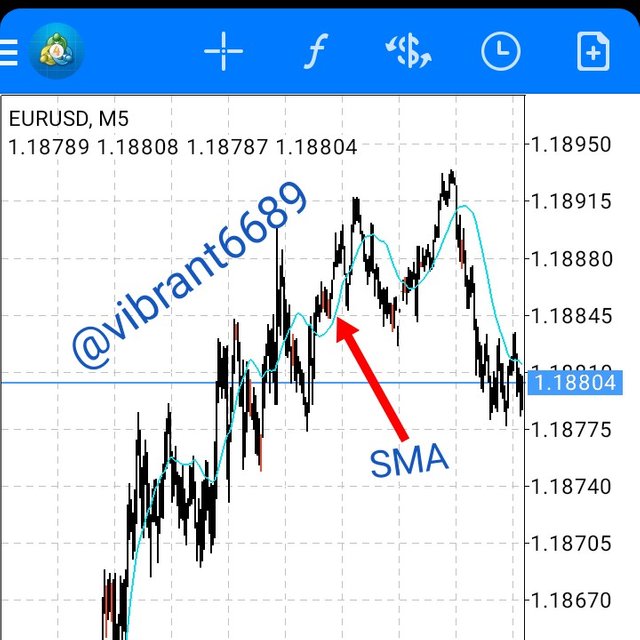
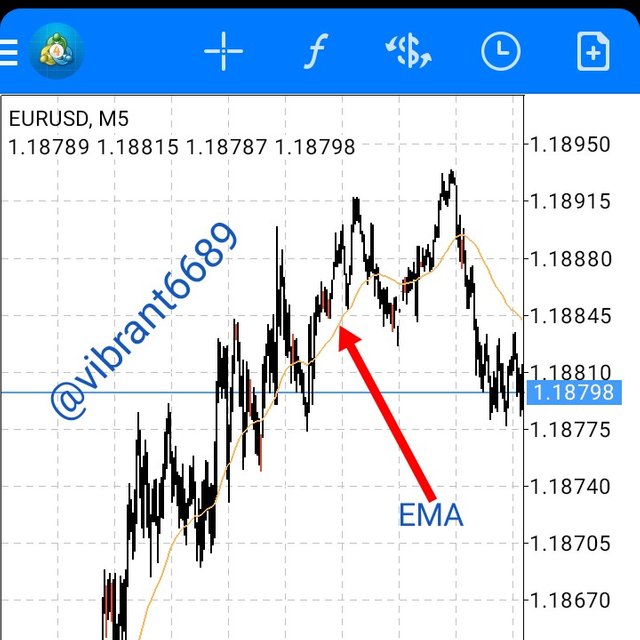
20 simple moving averages added
ADDING EXPONENTIAL MOVING AVERAGES
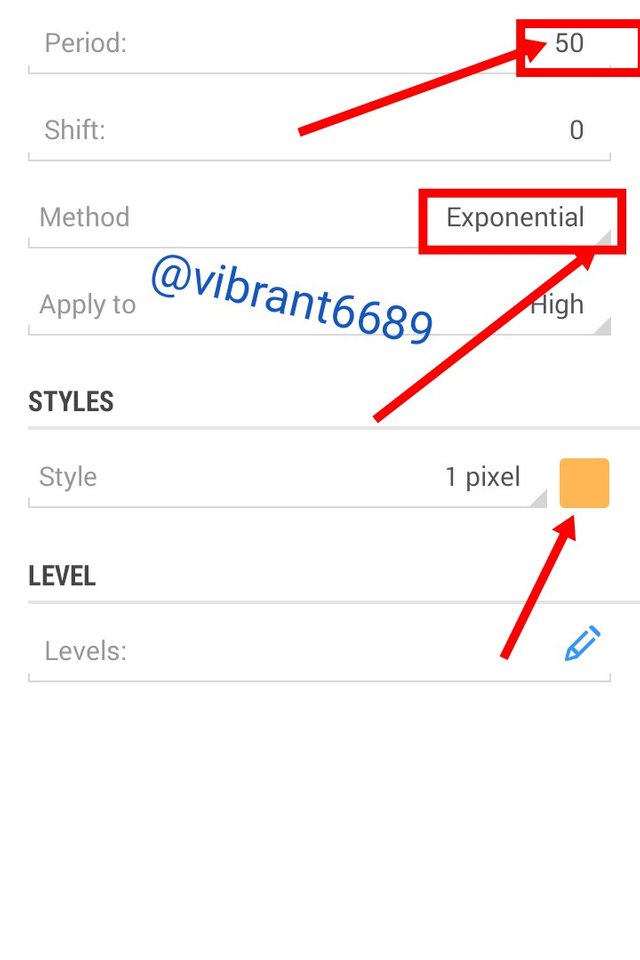
Then, to add the Exponential moving averages, you will still follow all the procedures above, except that you will now go to space that is written period. Edit it and add the EMAs you desire. I added 50.
You also go to the space that is written method and change it to Exponential...
Click done
Go back to the chart to confirm if it had been added, you will see..
Then, following thesame steps above you can add the two in one chart. Here you will have..
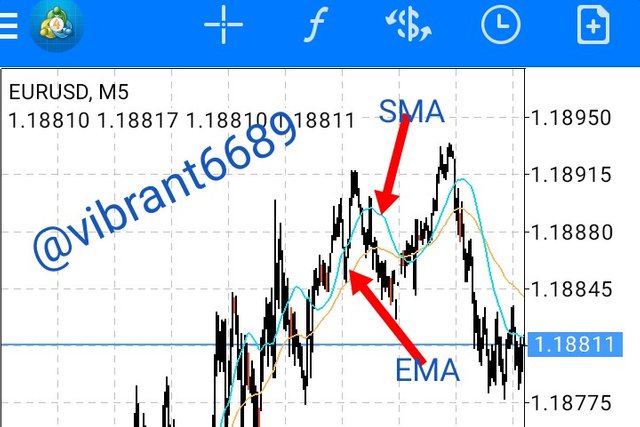
50 Exponential moving averages added
2. "USE FIBONACCI RETRACEMENTS" TO CHART A BULLISH AND BEARISH MOVE ( own screenshots only - nothing from the web)
To complete this task, I used my MT4 platform. Thus, following these processes..
⏩1, just tap on the chart. Circle that contains several tools will appear.
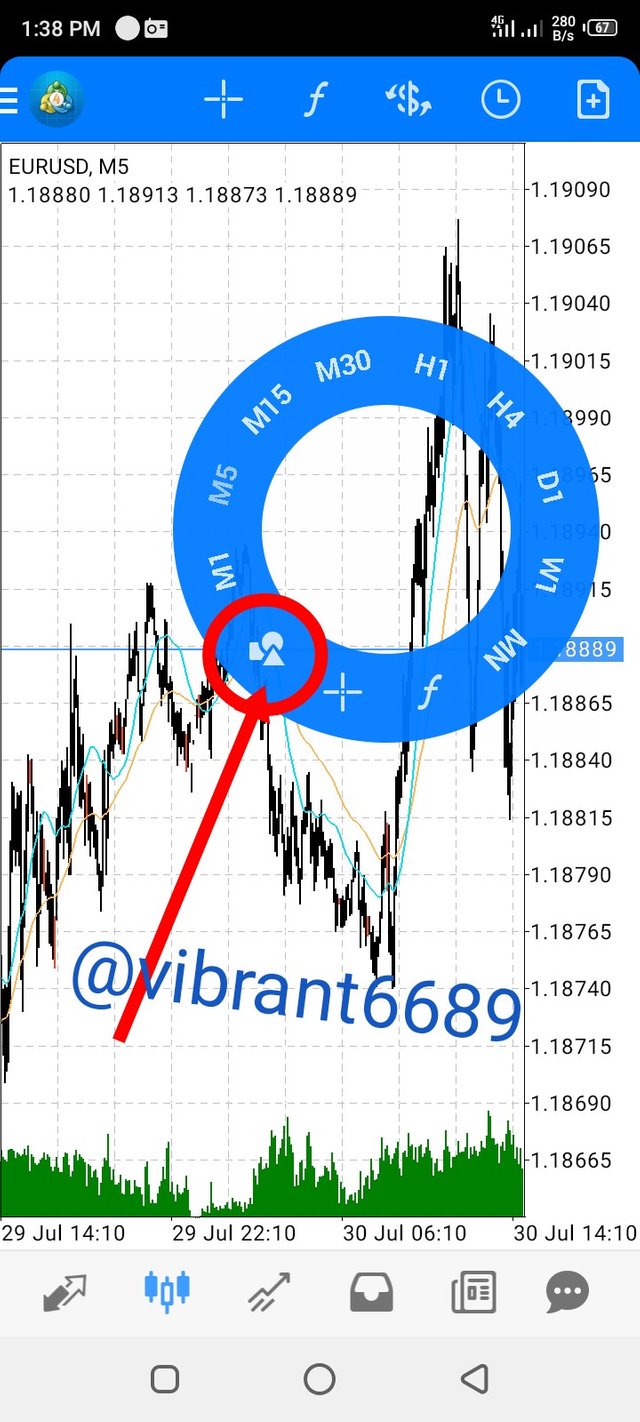
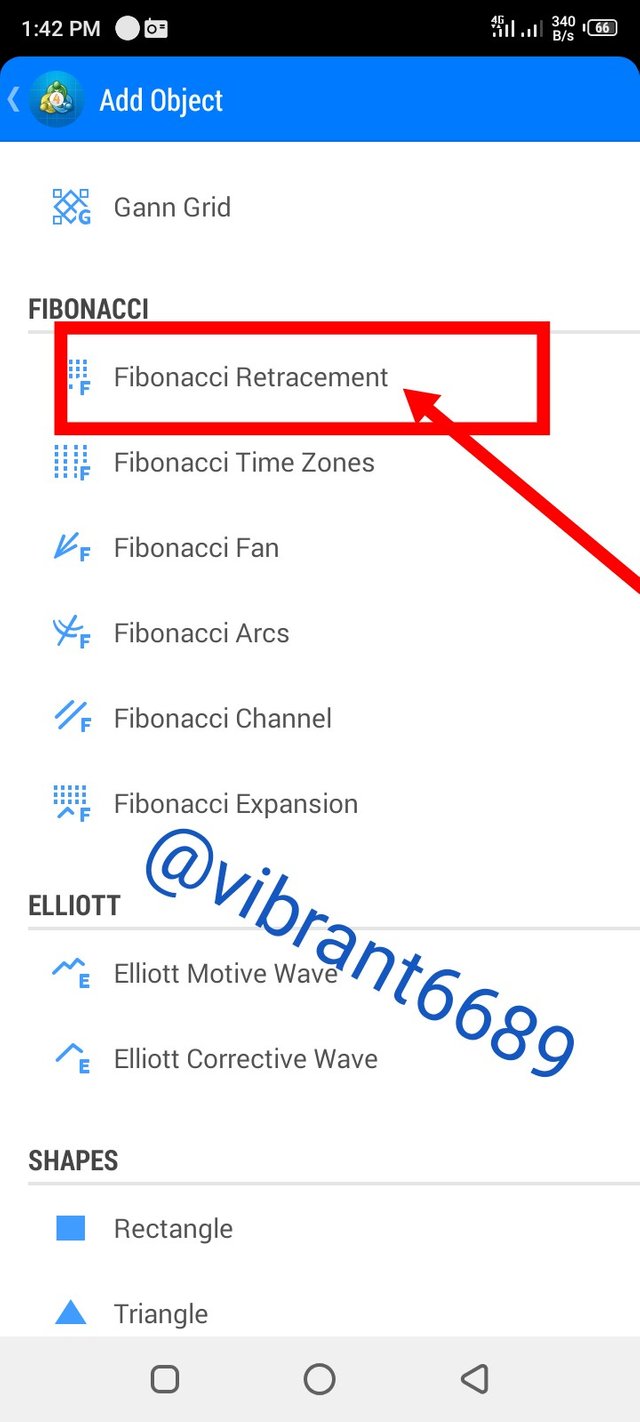
⏩2, the image below is what you will see in the next page.
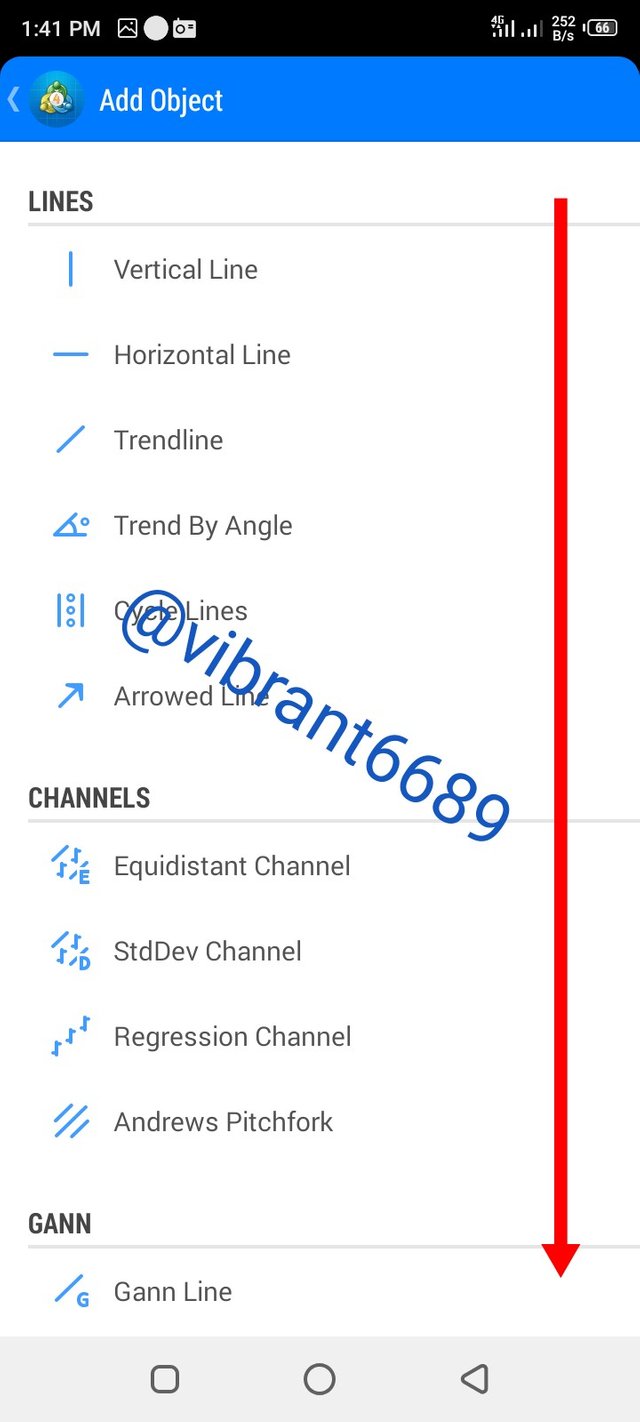
Let the arrow marker guide you as you scroll down to locate the Fibonacci tracement.
⏩3, click on it..
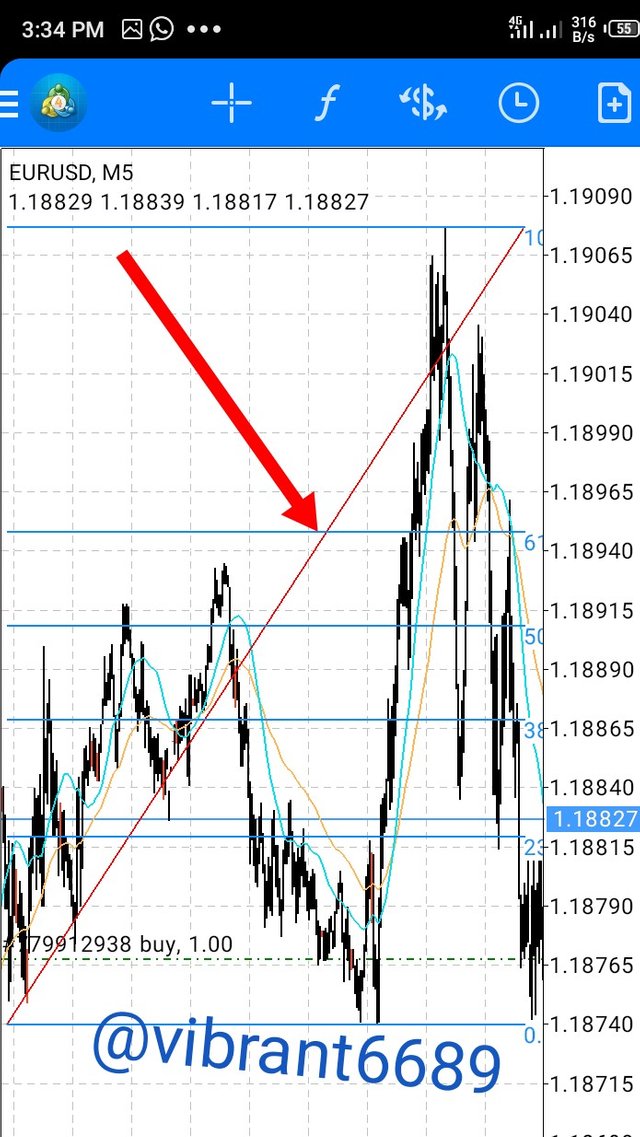
⏩4, after you have selected Fibonacci retracement. It will automatically refer you to the chart where you would be able to apply it in charting your desired move.
In the case, my target is bullish move. So, I drew a slope from the lowest level to the highest.
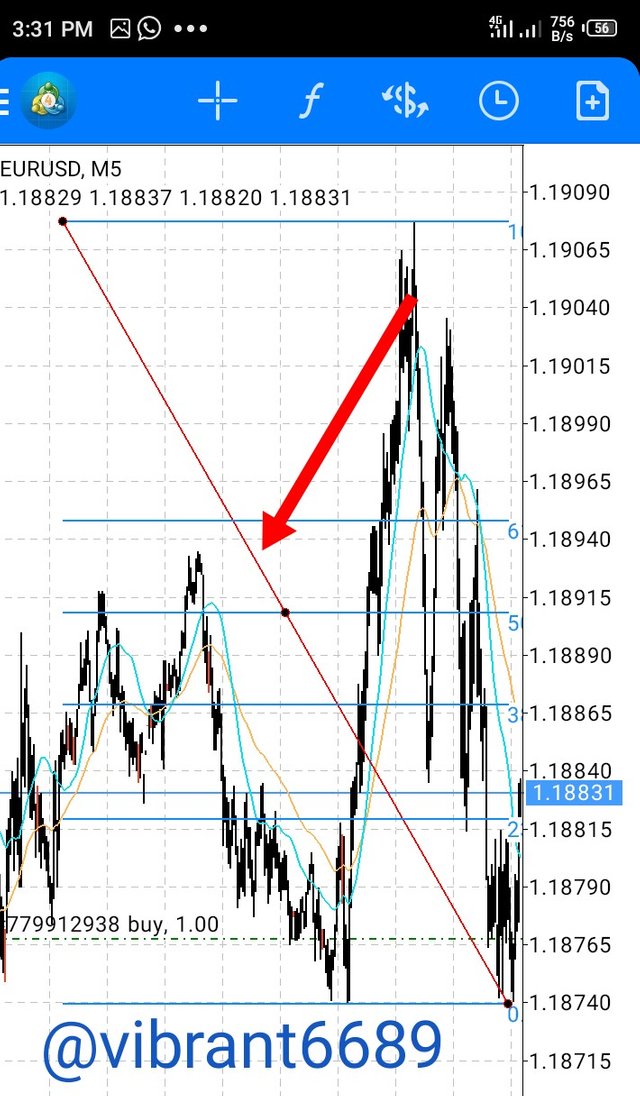
For Bearish Move
To draw for bearish move, you now draw from the highest point to the lowest point.
NOTE, ALL IMAGES EXCEPT THE FIRST IMAGE ARE SCREENSHOTS FROM MY META TRADER 4 APP.

CONCLUSION
Without twisting of words, I sincerely remit my unreserved gratitude to the erudite professor @lenonmc21 for such a detailed class which left no stone unturned.
Though doing the assignment wasn't as simple as it ought to be because of my inexperiencen, but it's worth it, because the challenges I encountered in the process of doing this assignment bullishly upgraded my understanding on the technical analysis tools, vis avis, Simple and Exponential Moving Averages, Fibonacci retracements and their application in practical trading.
All these tools are very important for professional technical analysis, and trading.
Special regards to professor..
@lenonmc21