Steemit Crypto Academy Season 3-Week 5 :- Trading Crypto With Ichimoku-kinko-hyo Indicator - Part 2
INTRODUCTION
Hello fellow steemians it's another week in Steemit crypto academy . The season has been going on well and I have already learnt alot form the assignments given. This week assignment will be a continuation of a previous class and we will writing on the
trading crypto with Ichimoku Kinko Hyo indicator part 2.
LET GET STARTED.
Discuss your understanding of Kumo, as well as its two lines.
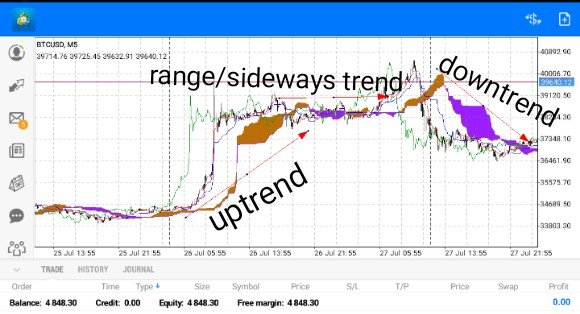
The kumo is part of what made up the Ichimoku Kinko Hyo indicator. It is one of the most important part of the indicator. It makes the indicator more easier to detect the trend of the market. And it has a strong relationships with the market price. It shows the market trend easily. The kumo is like a cloud in-between two lines. This lines make up the cloud and they are the Senkou span A and Senkou span B lines respectively. And this lines indicate clear support and resistance level in the market. The kumo give us the signal when and where to enter and exit a trade. It also reads the trend either uptrend, downtrend or sideways trend.
The Ichimoku clouds like I said gives us a clear meaning of the market trend. While looking at a chart with the Ichimoku Kinko Hyo indicator added to to it we just have to focus on the kumo then we will know the trend the market is about to take or building.
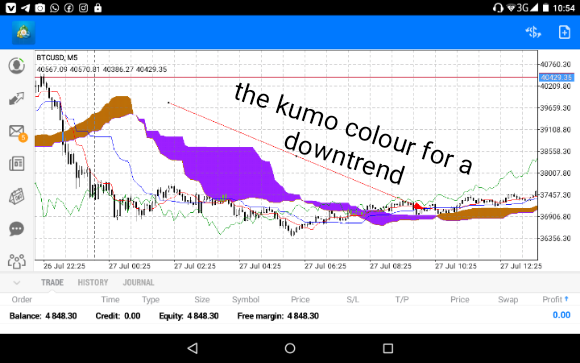
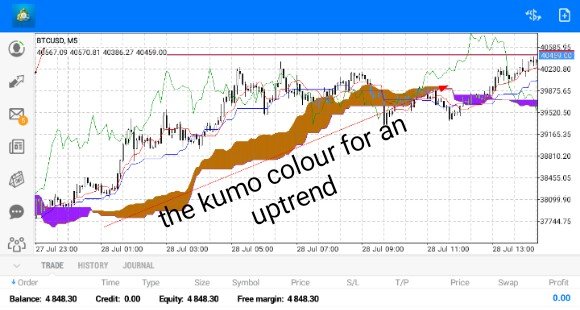
Below are images showing what the kumo looks like and the how it shows withe respect to the trend
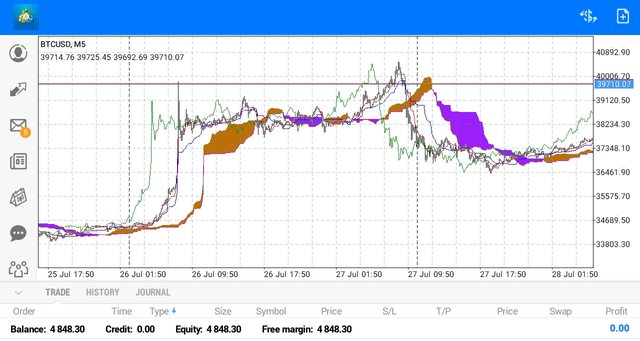
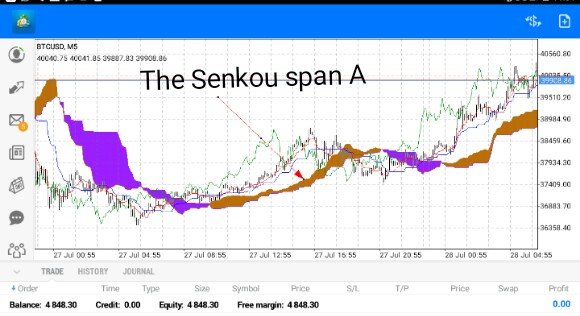
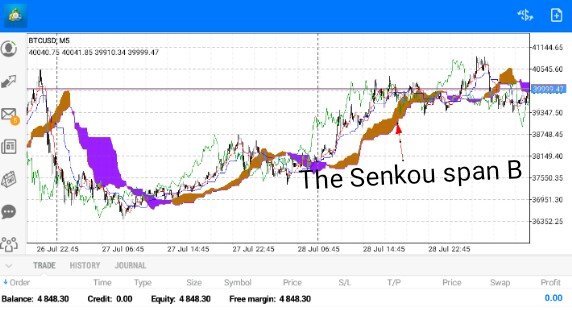
The Senkou span A and Senkou span B
This are the line that make up the cloud. The cloud lies in-between these two lines. The Senkou span A line is always above when the trade is in an up trend while it is always below the Senkou span B when the trade is in a downtrend. And when this two lines crosses each other it is indicating a trend reversal. Meaning the trend will change its direction.
- Senkou span A
This line can be used to determine the support and resistance level depending on the market trend. If the market is in an up trend it determines the support of the market and if the trend is downtrend it represents the resistance. While using the Ichimoku Kinko Hyo indicator we don't really need to draw our resistance and support line because this line has already indicated the support/resistance level in the market. We can use the line to pick our signals both entry amd exit point.
This line also has its own calculation so we won't be picking a wrong signal. To calculate this line we add the Tenkan-sen line and the Kijun-sen line together then we divide it by 2 mathematically, Senkou span A= Tenkan-sen line + Kijun-sen line/2 over 26 period backwards.
- Senkou span B
This is the second line that makes up the kumo. This line it's used to determine our level of risk once the price is already crossing the Senkou span B line then we should exit the trade. I will say it serves as an exit signal it self. And this line is always set to 52 period.
It can me calculate by adding the highest candlestick and the lowest candlestick then divided by 2 over a period of 52 days. Mathematically, Senkou span B= highest + lowest /2 over 52 period and a extension of 26 days.

What is the relationship between this cloud and the price movement? And how do you determine resistance and support levels using Kumo?
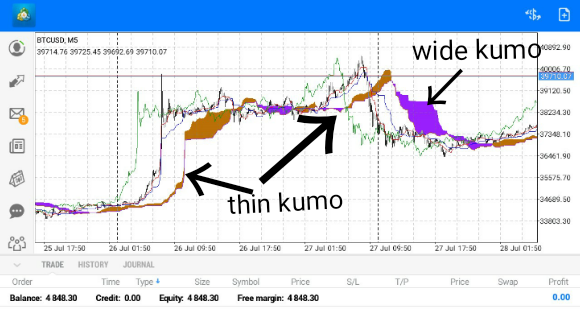
To determine the relationship between the cloud and price movements, we have to study the chart that has the Ichimoku indicator added to it then we notice that the kumo is thick/wide at some point the will be thin / narrow at some places in the same trend. We have to be careful, when the cloud is tiny/compressed it means the uptrend is still very strong the price is high. Maybe the uptrend is still fresh. After some times the cloud will start expanding. We should not rush into the market at this point.
When the cloud is wide it means the price is somehow stable the increasement is not too steady. If we had rushed in we might end up lossing our investment. When the cloud is wide the trend is likely to be moving sideways now. It has gotten to the end trend. We should just wait for another setup.
How do you determine resistance and support levels using Kumo?
To determine support and resistance point with the cloud we just have to observe the Senkou span A line it is the line That determines the support and resistance point. Based on my observations I noticed that whenever the price is in support the Senkou span A line is always flat at that point. Bothe resistance and support point the line is always flat at that point.
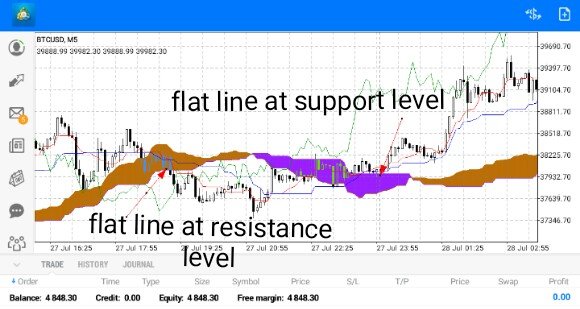
Now that we have identified the resistance and support line withe the kumo we just habe to be careful full because sometimes the price won't break the Senkou span B And the line will be flat already. Thats a fake signal. Bellow is a screenshot showing the support and resistance point
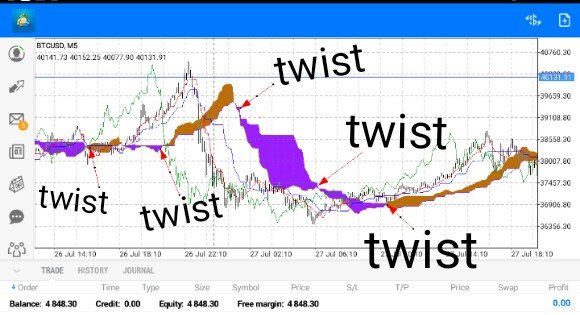
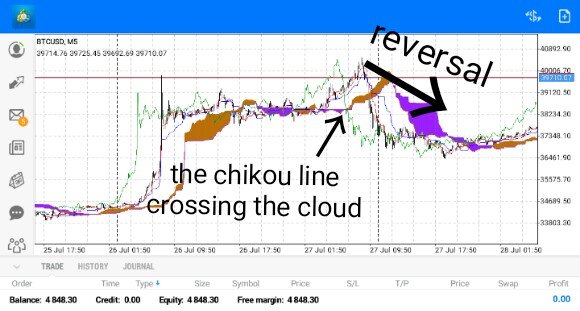
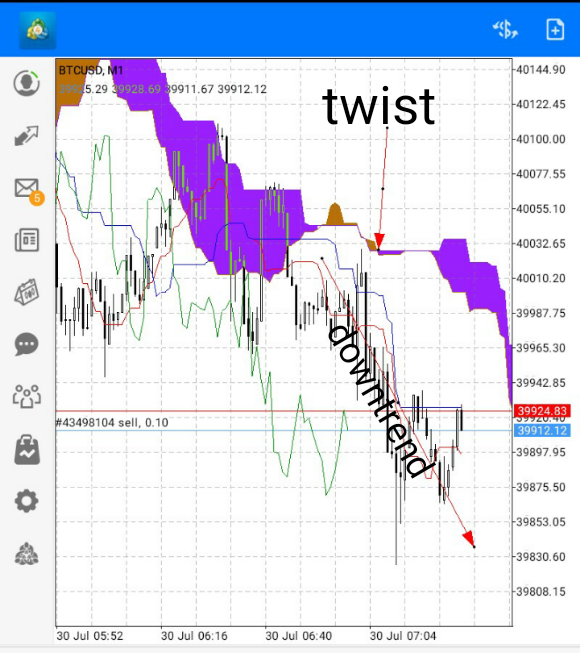
How and why is the twist formed? And once we've "seen" the twist, how do we use it in our trading?
As we have learnt before that no uptrend or downtrend will be forever. So that is where a twist comes in. A twist is the Senkou span A and Senkou span B after a significant trend. The twist is indicating that the trend is already weak and there is about to be a change in the trend.
A twist is caused by a weakened trend. For example the chat of BTC has be going down and we know that it won't keep going down forever it will get to a point where it will have to reverse that trend. A twist is caused by a reverse I the trend of the market price. When a twist is formed we should know that market is about to reverse it's structure. We can consider a twist in the SSA and SSB as a signal for reversal trading. It might first go in the range form with a few candle befor changing the trend.
Now that we already know that the twist leads to a reverse trend. All we need to do is that once we see a twist in the kumo line we sell if the previous trend is an uptrend and we buy if the previous trend is a downtrend.
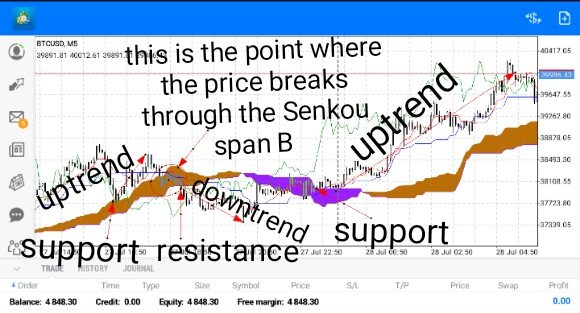
You will see that this screenshot illustrated everything I have explained earlier.
What is the Ichimoku trend confirmation strategy with the cloud (Kumo)? And what are the signals that detect a trend reversal?
The Ichimoku trend confirmation strategy is a very clear strategy and easily detected on sight. Once we look at a chat that has this indicator on it, we will know the market trend instantly. This indicator is always clear on the chart. I will call it a visible indicator. It doesn't need any special settings. It signals are easily detected. And also all the line that made up this Ichimoku Kinko Hyo indicator all have a very useful functions. They detect the same signals at almost the same time.
The Ichimoku trend confirmation strategy with the kumo is a very visible signal. It is specially colored to differentiate the trend from each other. When the market is in a downtrend the kumo colour is purple and when it is in an uptrend, the kumo colour is orange. This colour varies though depending on the app I think.
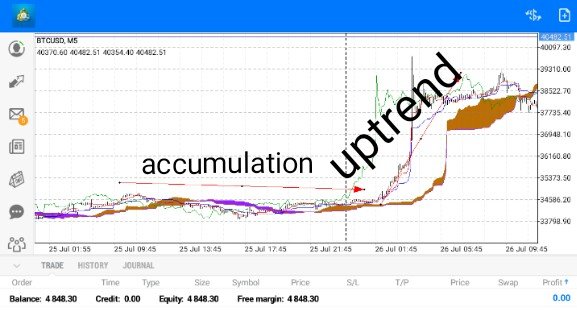
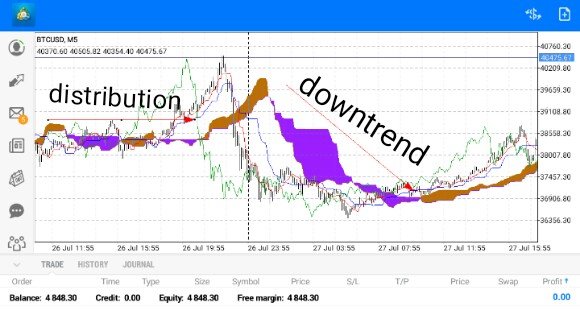
And also there is an equilibrium trend in the market. At this point the price is always stable. It's not moving in any trend it will just be moving in a sideways trend. When the price started moving in a sideways trend it means the price is already weak from the previous trend it's is moving from then it's start moving in a sideways direction. To explain this strategy when the price is moving in a sideways trend. It means two things Accumulation and distribution.
Accumulation is when buyers are entering the market. People keeps buying position this will make the trend go in a sideways direction but once it can't accumulate anymore it breaks that trend which leads to an uptrend. While distribution is when buyers started selling off their positions and the price will become weak so it will start moving in a sideways trend once they sold all positions it will then lead to a reverse in the trend.
Another signal is the crossing of the SSA and SSB line this signal indicate a trend reversal. So when we see this sign we should exit our current position or we should change change our trade because the trend will also change.
The Ichimoku Kinko Hyo indicator analyses the price equilibrium and Support and resistanance. The indicator indicates a very strong support/ resistance point because the price doesn't really penetrate through the lines of the tenkan line.
Another signal of for reversal trend is when the slower curve that is the SSB line we have to wait for the line to move in the direction of the trend.
And lastly the chikou line must have broken the cloud then the signal is a strong one. This final confirmation is like the authentic signal because it is certain that the trend will reverse
Explain the trading strategy using the cloud and the chikou span together
The chikou span is one of the lines that made up the Ichimoku Kinko Hyo indicator. The line is commonly known as the lagging span. It is represented by Plotting closing prices 26 period behind latest closing price of the asset. This line shows relationship between current and prior trends.
Now to consider using the span and the cloud for our signals all we need to do is to monitor the line and see the relationship and how price reacts to this relationship.
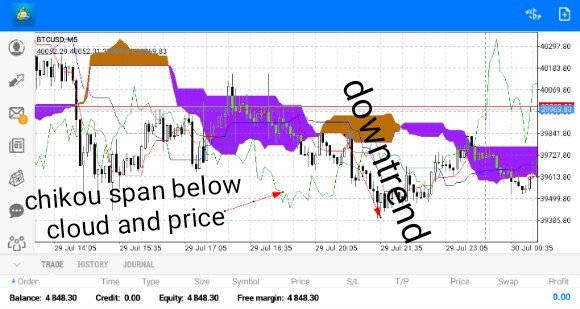
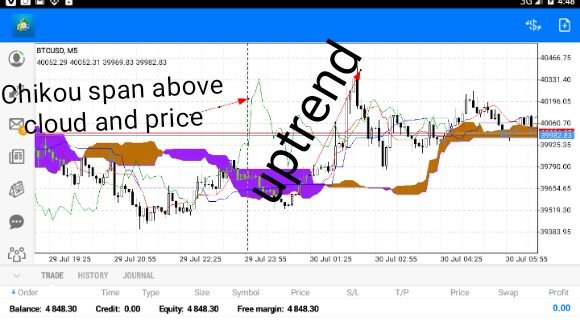
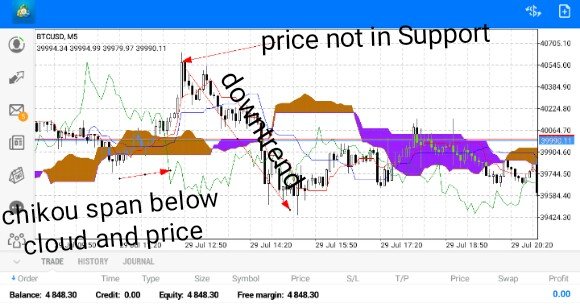
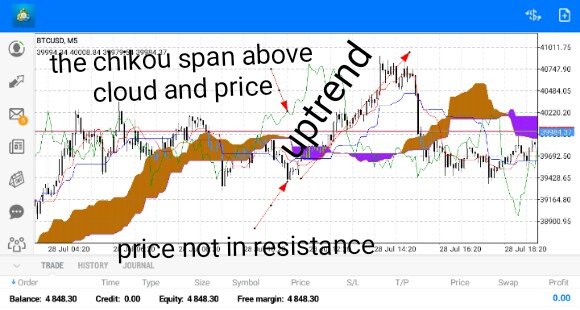
When the Chikou span line is above the cloud and the price then there will be an UPTREND, if it is below the cloud and the price then there will be a downtrend. Knowing this we already have a validated signals. We can use it for buy and sell order.
If the chikou span curve is above the cloud and the price but the price haven't gotten to a resistance points we can take a buy order. And also if the span is below the cloud and the price but the price is not making support we can place a sell order. If the four conditions are not met when we want to use the cloud and the chikou span to pick a valid signal then we shouldn't trade using the strategy.
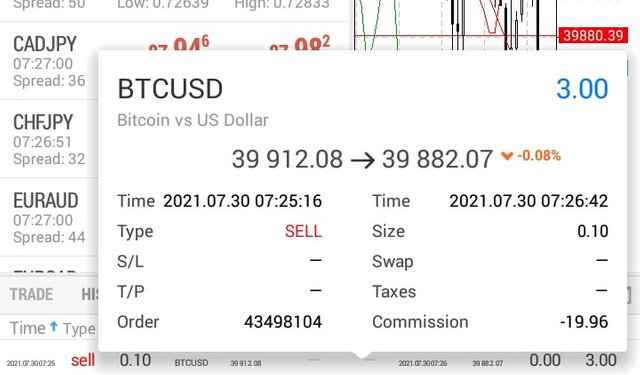
Explain the use of the Ichimoku indicator for the scalping trading strategy
The Ichimoku indicator can be used to trade on both higher and lower time frame. So as a scalper you just have to reduce the time frame to a lower maybe 15-1min time frame. After check all the set and getting a good signaler can buy or sell depending on the signal we are trading with. Below are screenshot from a scalping trade I performed
CONCLUSION
Finally the Ichimoku Kinko Hyo indicator is a very good and reliable indicator. It shows the trend of the market just in one glance. It give strong support and resistance signals. It's also shows signals for reversal trading also. Based on its relationship with price it's signals are literally visible to trader using the indicator.
CC @kouba01
Hello @vhenom,
Thank you for participating in the 5th Week Crypto Course in its third season and for your efforts to complete the suggested tasks, you deserve a 6/10 rating, according to the following scale:
My review :
An article with acceptable content that contained answers to some questions that lacked depth in the analysis, and I will note some of the observations for you:
Your interpretation of the cloud for the Ichimoku indicator and its components was good and clear in all its aspects.
For the second question, your answer regarding the relationship of price movement momentum to the cloud is correct as well as how to identify support and resistance levels, but it lacks more depth in analyzing.
Very often when the cloud twists after a period of trend, prices enter a range (in 75% of cases). The twist indicates a weakening of the trend and in no way a change in trend to come.
This information is given to us in advance giving the trader time to act and consider taking his profits. The trader can also prepare to trade the probable range to come. By watching the twist, we will know faster than others that the trend is likely to run out of steam and we will be ready to trade the range before everyone else.
The last question about using the Ichimoku indicator in scalping your answer was superficial and did not provide the required information.
Thanks again for your effort, and we look forward to reading your next work.
Sincerely,@kouba01
Thanks for the review will do better next class
Congratulations! Your post has been selected as a daily Steemit truffle! It is listed on rank 14 of all contributions awarded today. You can find the TOP DAILY TRUFFLE PICKS HERE.
I upvoted your contribution because to my mind your post is at least 7 SBD worth and should receive 21 votes. It's now up to the lovely Steemit community to make this come true.
I am
TrufflePig, an Artificial Intelligence Bot that helps minnows and content curators using Machine Learning. If you are curious how I select content, you can find an explanation here!Have a nice day and sincerely yours,

TrufflePig