Steemit Crypto Academy Season 2-Week4 | Cryptocurrency Trading with RSI
INTRODUCTION.
Hello fellow steemians. Welcome to another week in the steemit crypto Academy. There have been several courses on different topics and am really enjoying it and also learning new things on the courses. I'm glad to attempt @kouba01 lecture on CRYPTOCURRENCY TRADING WITH RSI
What is the Relative Strength Index - RSI and How is it Calculated?
First there are many indicators used by trader in forecasting the future price or the next possible movement of the market indifferent time zones which allows them to make profit. Many trader uses the indicator that suits their types of trade. But when we are talking about the relative strength index RSI It helps to give a better prediction of the market. With the range of the RSI one can predict the next possible moment of the market either its a buy trade or a sell trade. RSI is used to determine either the trade is overbought or oversold.
The RSI ranges from 0-100 scale when the RSI graph is below the scale of 30- 0 then the market is oversold also known as while if the RSI graph is above the range of 70- 100 then the market is overbought.
To calculate the RSI you use RSI= 100 - 100/(1+RS)
Where RS is the relative strength = avg gain / avg loss
Can we trust the RSI on cryptocurrency trading and why?
I would say we can trust the RSI 100% because it gives a weak signal at times which can cost the trade a loss. So it should be supported with other trading strategy to have a better trade. If the stop loss is used with the RSI its make its easier because if the RSI shows a weak signal the stop loss will be there to reduce your loss. So i will say it should not be totally trusted and should be supported with other indicator also.
How do you configure the RSI indicator on the chart and what does the length parameter mean? Why is it equal to 14 by default? Can we change it? (Screen capture required)
To add my RSI I go to the market chart from my metatrader4 app
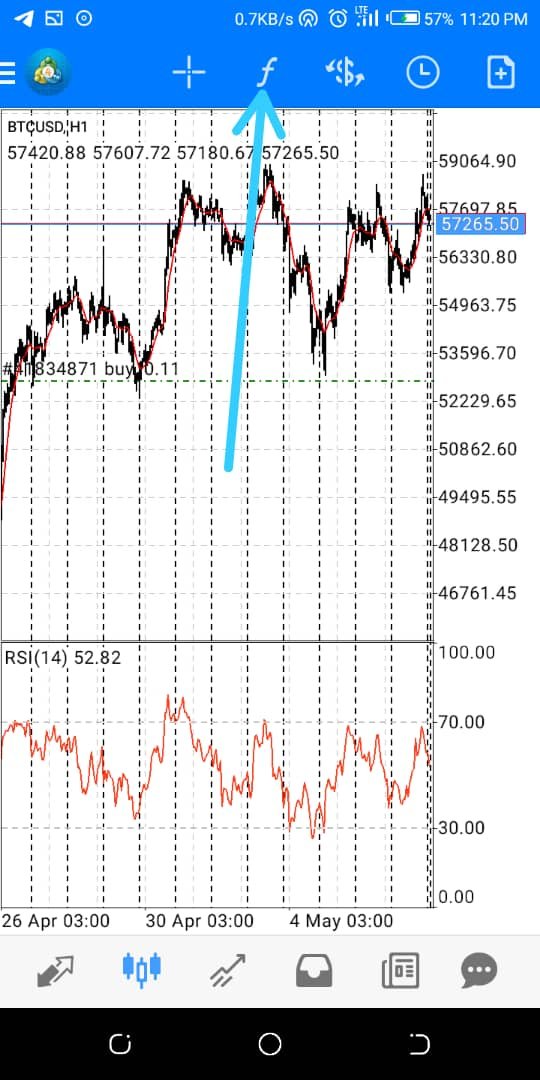
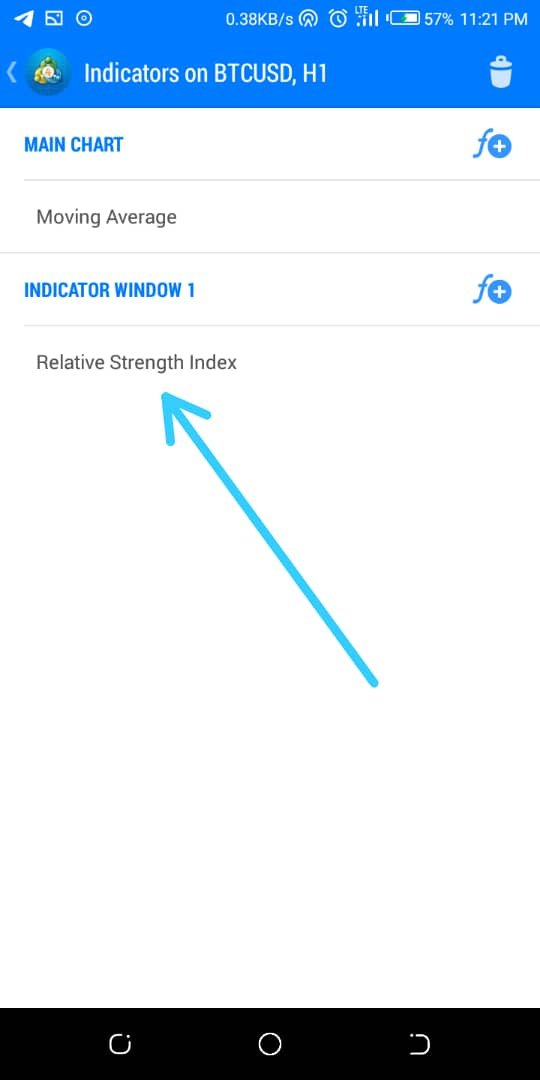
I already signify where to click so after clicking on the you will click on relative strength index
Here you can see the period 14 its shows the RSI (14) and it can be edited to give you a better view of how the market has been going from the number of days you set till date
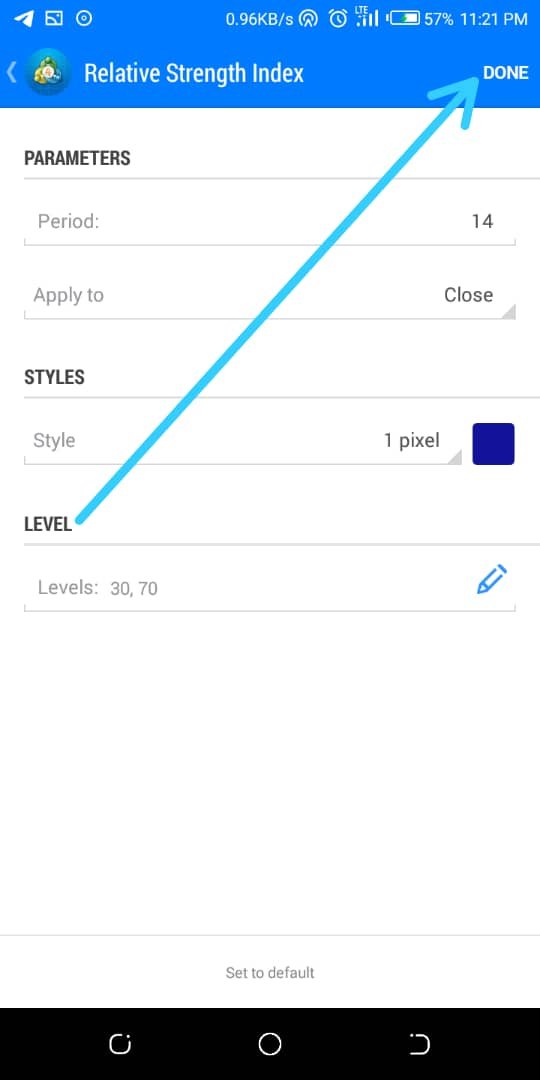
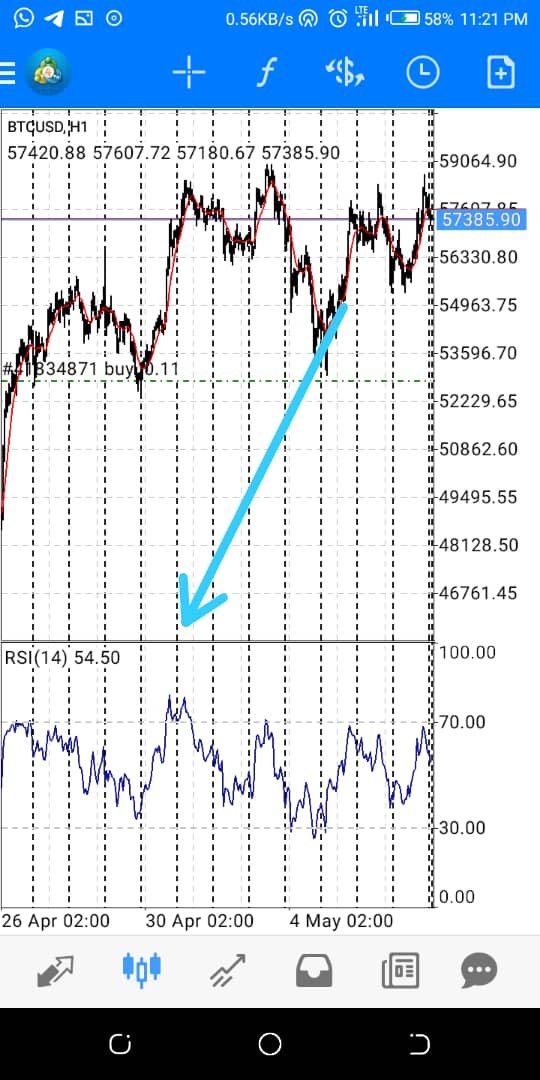
You change edit your RSI here how you want to be viewing your RSI by changing the color, period & levels as shown above. Them your RSI, is ready.
How do you interpret the overbought and oversold signals when trading cryptocurrencies? (Screen capture required)
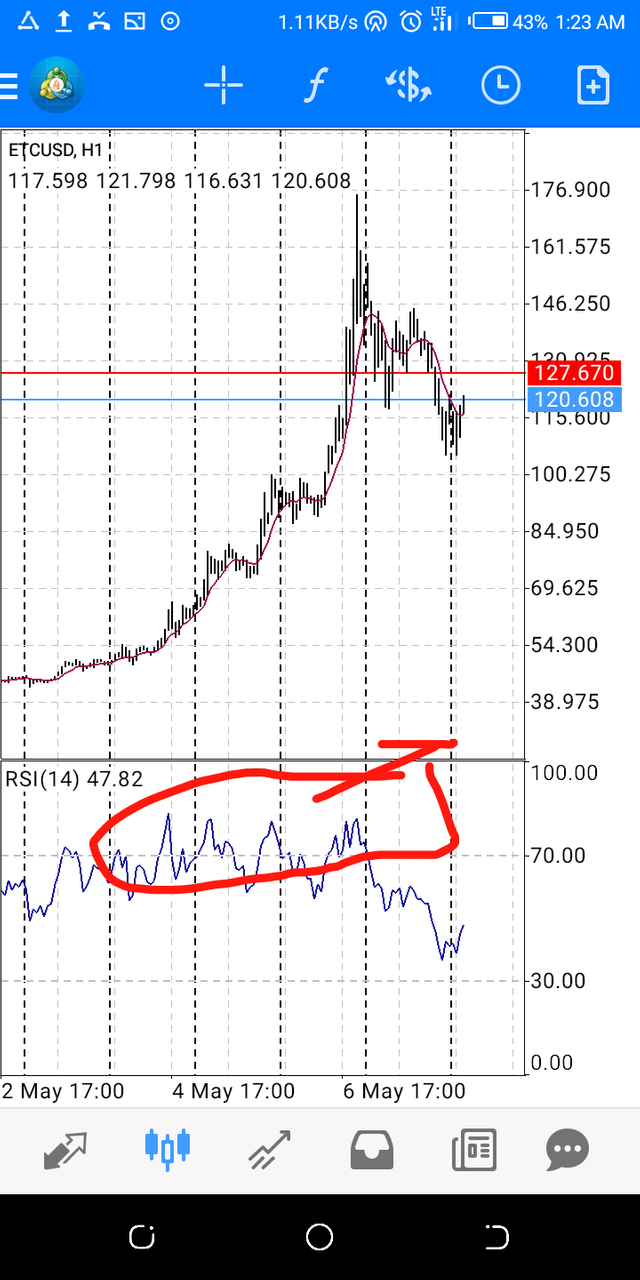
This market is overbought which makes the RSI above the 70level. When the graph is above 70 now in the range of 70- 100 its means demand is more than supply which means the market overbought.
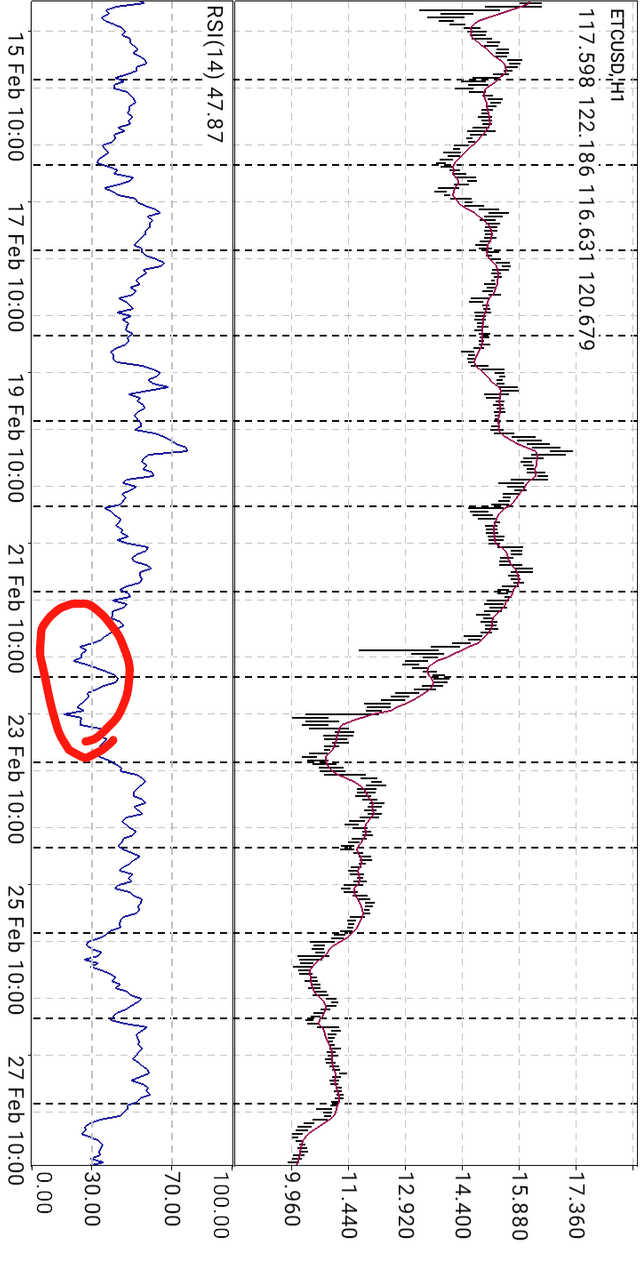
Over sold is when the the price of the asset goes beyond the scale of 50-30 to the scale of 30-0 when we see this we know the market is oversold. Meaning supply is more than demand.
How do we filter RSI signals to distinguish and recognize true signals from false signals. (Screen capture required)
RSI divergence is a way to get active signal before losses occur. When the RSI line goes high or higher high or vise versal its suppose to go with the market price but if the RSI goes otherwise then we introduce the divergence which are bullish and bearish
To filter RSI signal one needs to use it with other indicator like SMA parabolla and likes of others to be sure if the signal is weak or strong. Divergence is the filtration of recognizing weak signal from a strong signal
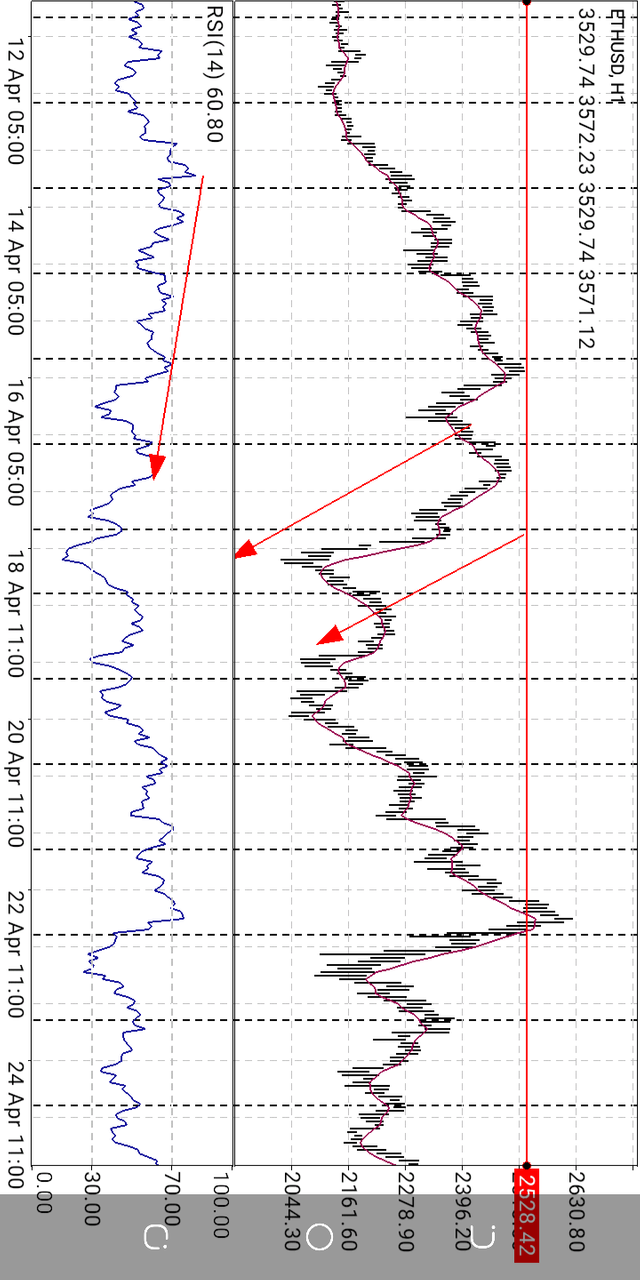
Bullish divergence occurs when the price of an asset is falling given rise to a pertern known as dips which is bearish but the RSI indicator marks higher low this is a strong signal for buy in the oversold zone.
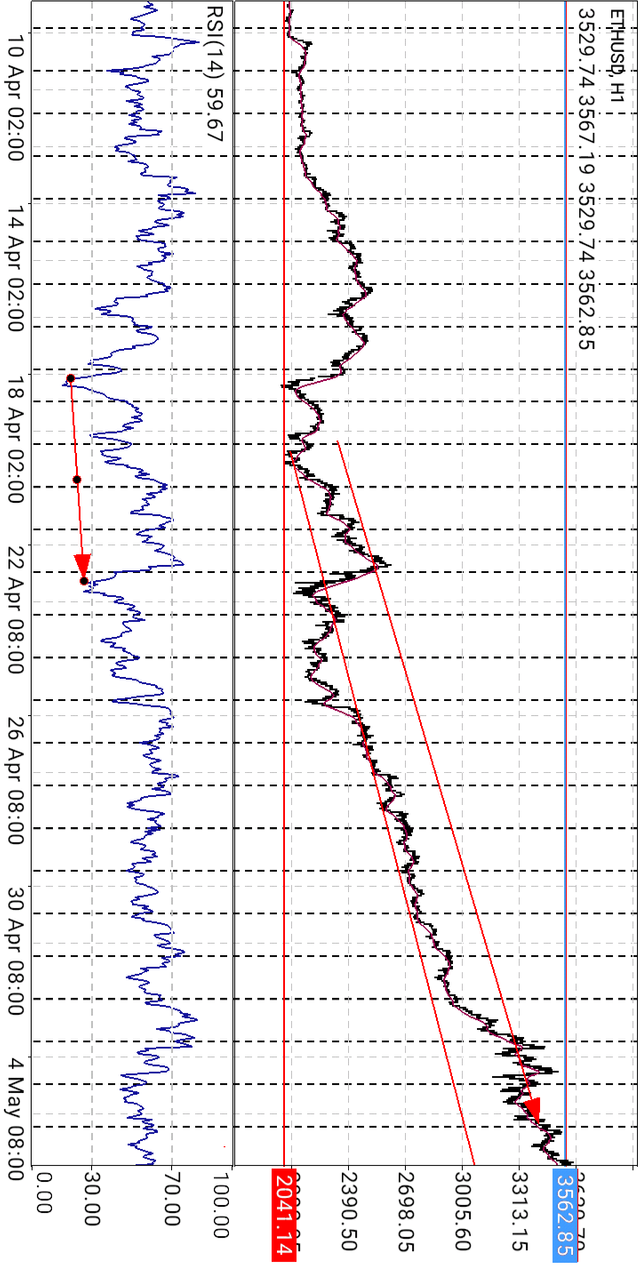
Bearish divergence s when the asset peaks higher and the RSI indicator marks lower. It is a strong signal if it happen in the overbought zone, indicator shows that they are both price reversal if a trader can spot them there is assurance of scuring more gain than loss
Review the chart of any pair (eg TRX / USD) and present the various signals from the RSI. (Screen capture required)
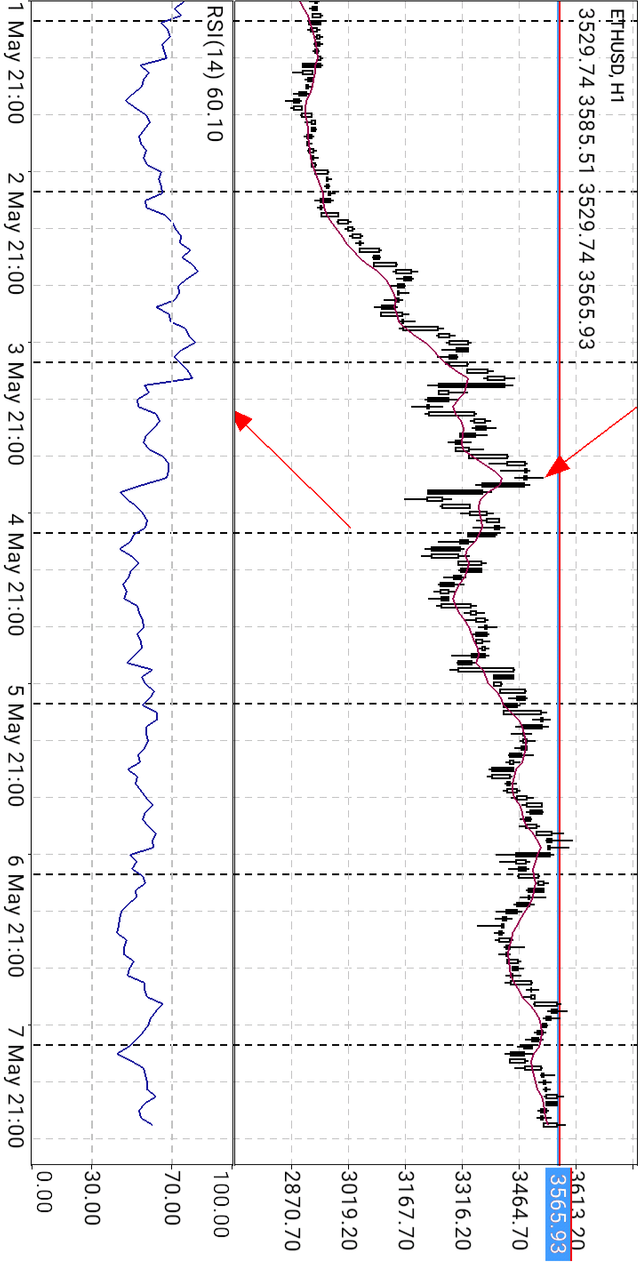
The above screenshot shows the RSI above 70 which is the overbought zone giving an opportunity for a sell order
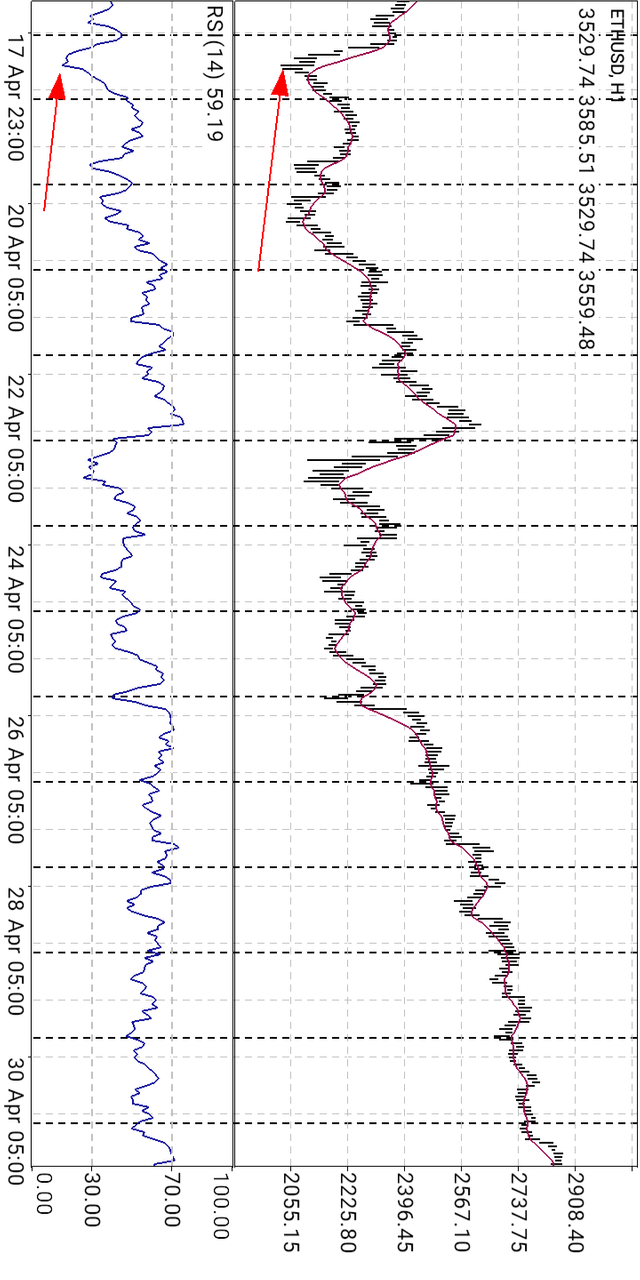
The screenshot above shows RSI crosing the oversold zone which is below 30 giving a better opportunity to buy
CONCLSION
This is a great lecture from @kouba01 I have been trying how to read the RSI indictor for a long time now. Thanks for this lecture i now understand the how to use the RSI INDICATOR.
CC @kouba01
Hi @vhenom
Thanks for your participation in the Steemit Crypto Academy
Feedback
You just simply tried though not good enough. Kindly invest enough time in both your research and in writing your articles.
Homework task
4