Steemit Crypto Academy Season 2- Week 8 : Cryptocurrency Trading With Bollinger Bands
INTRODUCTION
Today's course is based on technical analysis indicator used in Cryptocurrency market. I will be writing on Bollinger Bands indicator. It's is one of the most used indicator.
Define the Bollinger Bands indicator by explaining its calculation method, how does it work? and what is the best Bollinger Band setup?
Bollinger Bands indicator is one of the most used indicator. It is the type of indicator that moves with price action and volatility of the moving average. The Bollinger Bands work as an oscillator measurer. Measuring weather or not the market has high or low volatility.
The Bollinger Bands is made of three bands the upper band, the lower band and the middle moving average line. When the volatility is high the upper and lower bands move away from the middle moving average line, and if volatility is low they contrast moving towards the middle moving average . The upper and the lower band react with the market price. Though the Bollinger Bands doesn't predict the future price with accuracy but we can predict the possible value or trend.
To calculate the Bollinger Band we set the middle line to 20days simple moving average (SMA) we then calculate the upper and the lower band in respect to our Simple moving average (SMA) base on the volatility of the market which is known as standard deviation.
After we set our standard moving average to 20-days simple moving average, we will add it to 20-days standard deviation twice and we will sbutract 20-days standard deviation twice also for the lower band
- Upper band = moving average (20-days SMA) + 2 standard deviation (20-days)
- Lower band= moving average (20-days SMA) - 2 standard deviations.
Though we can set the number of days of the simple moving average to our preferred choice irrespective of the SMA we have to calculate the number of standard deviation to add to get a correct measurements of the indicator.
What is a breakout and how do you determine it?
Breakout in a cryptocurrency market chart is the point when the market trend rise above the existing resistance or falls bellow the existing support. Breakout is when the market trend goes beyond the normal market trend of falls out of the market trend.
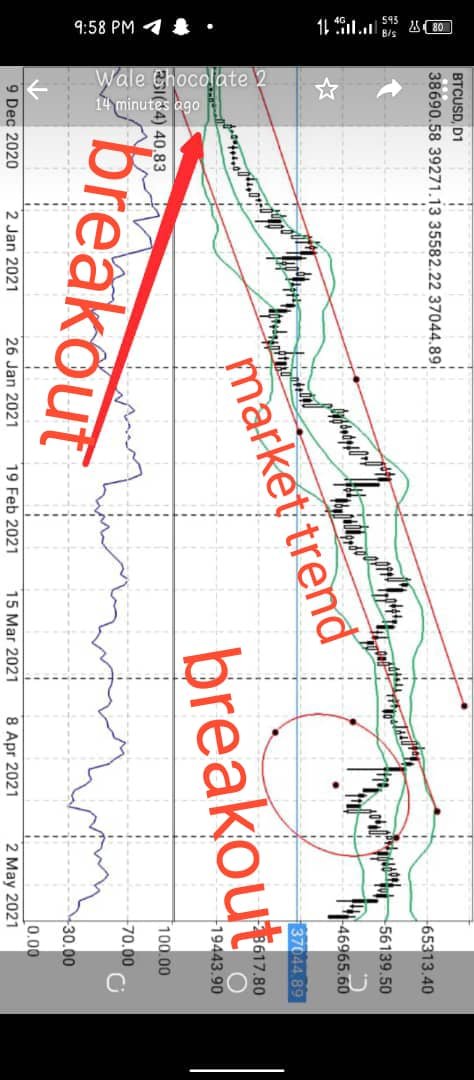
This is a breakout out point. The market trend took another dimension/direction. The first breakout point is in the upward trend. It lead to an overbought market, while the market took another trend and another breakout still change the direction of this market the downtrend leading to oversold. A breakout always has huge effect on the market price both positively and negatively. It's either the price becomes too high or too low.
How to use Bollinger bands with a trending market?
To use the Bollinger Bands with a trending market. It has to be used with a supporting indicator to make it effective. And we should not consider the Bollinger Bands as an indicator for detecting the best buy and sell position.
Now lets interpret the data of the Bollinger Bands indicator.
If we want to consider the Bollinger Bands indicator for picking buy and sell positions. If the price rise above the middle simple moving average and exeed the upper band then we can consider the market over bought.
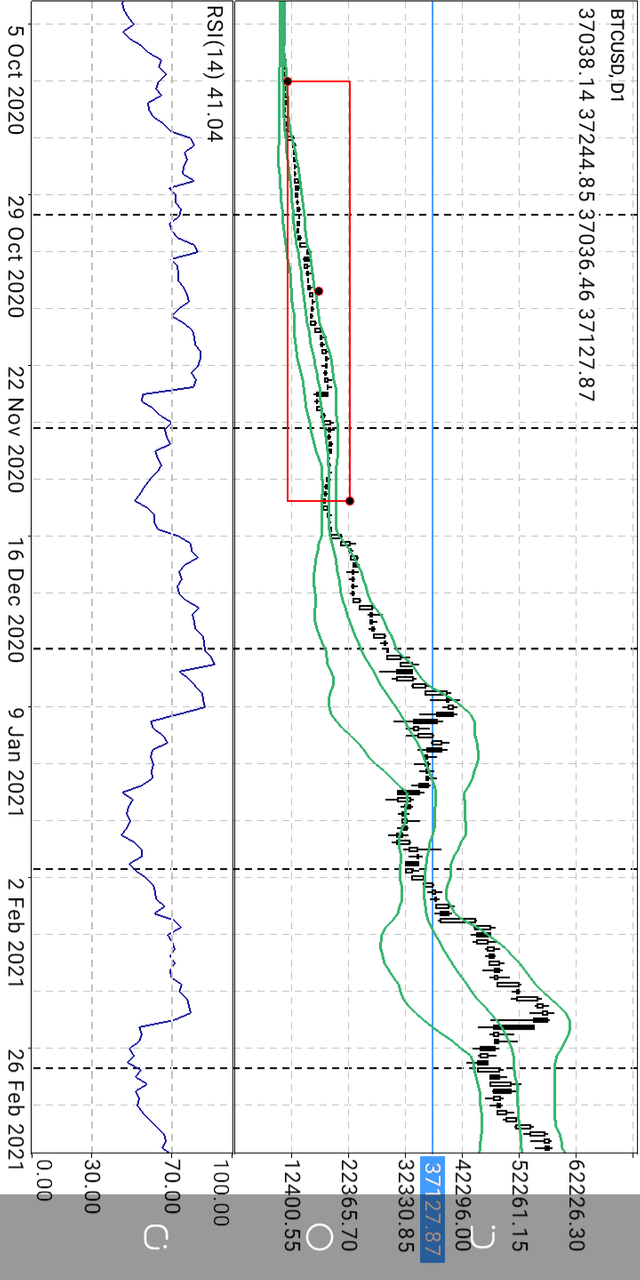
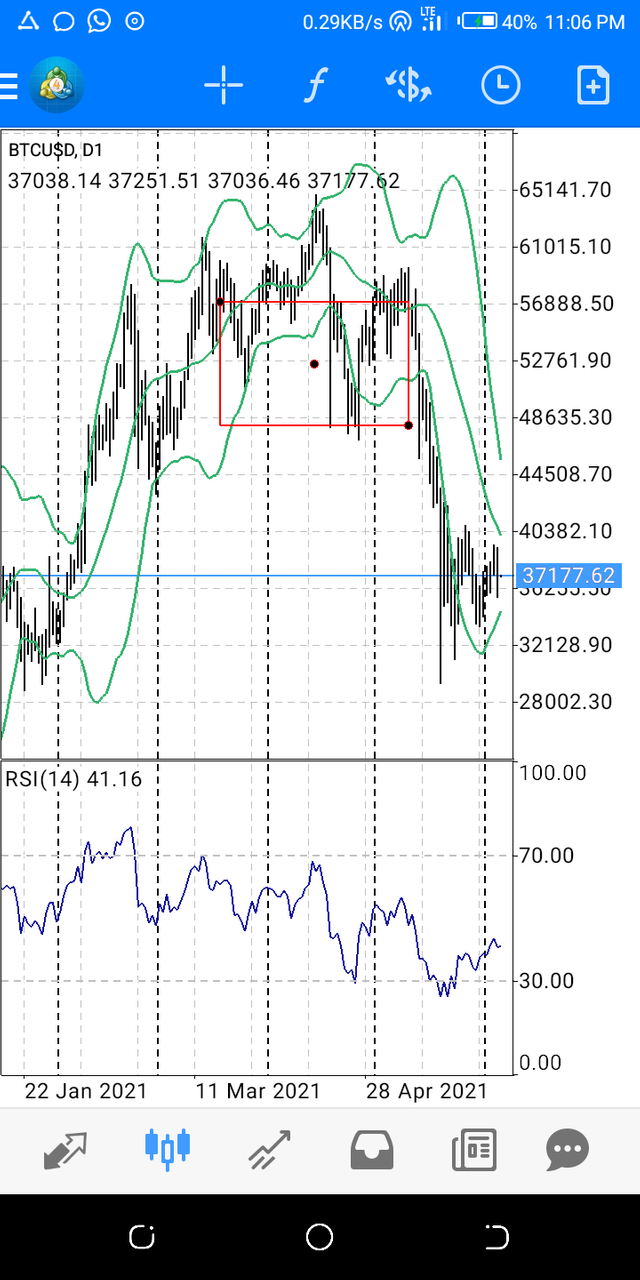
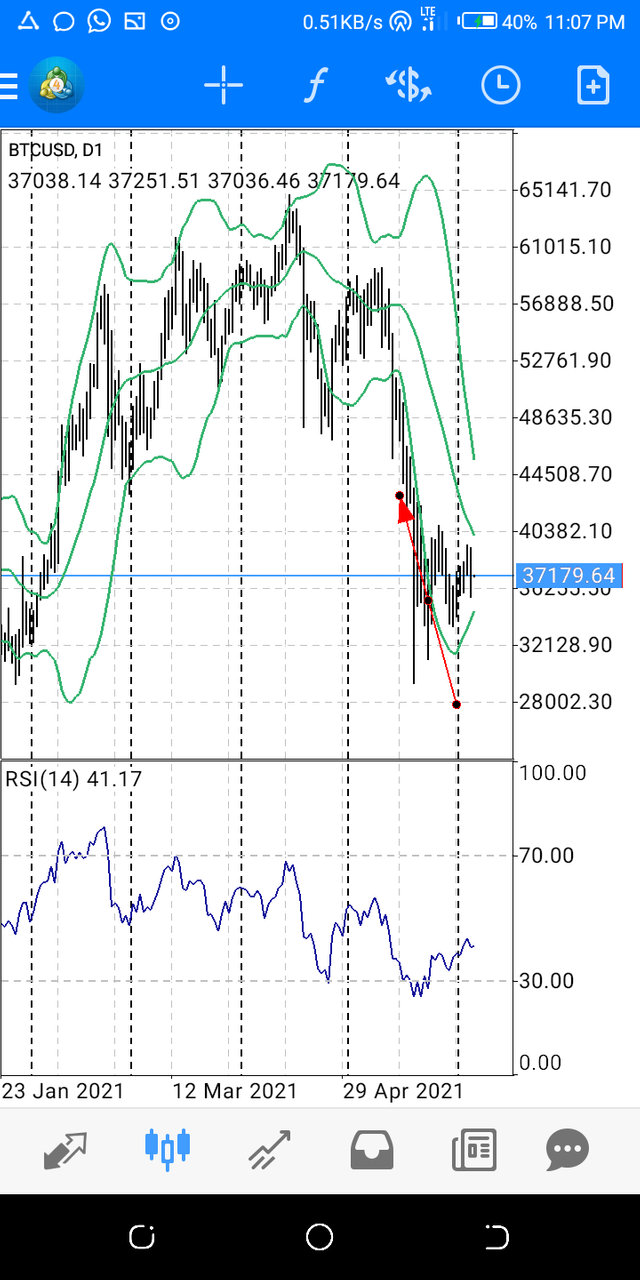
Let's take a look at this graph the candlestick in the triangle drawing are all above the middle moving average and are touching the upper band. This is a great sign that the marker is over bought. Investors are buying aggressively the price will increase. And the market will take an UPTREND soon we can see in the next chat there is an UPTREND
Then if we want to know that the market is in resistance the candlestick will keep rising above the upper band.
 .
.
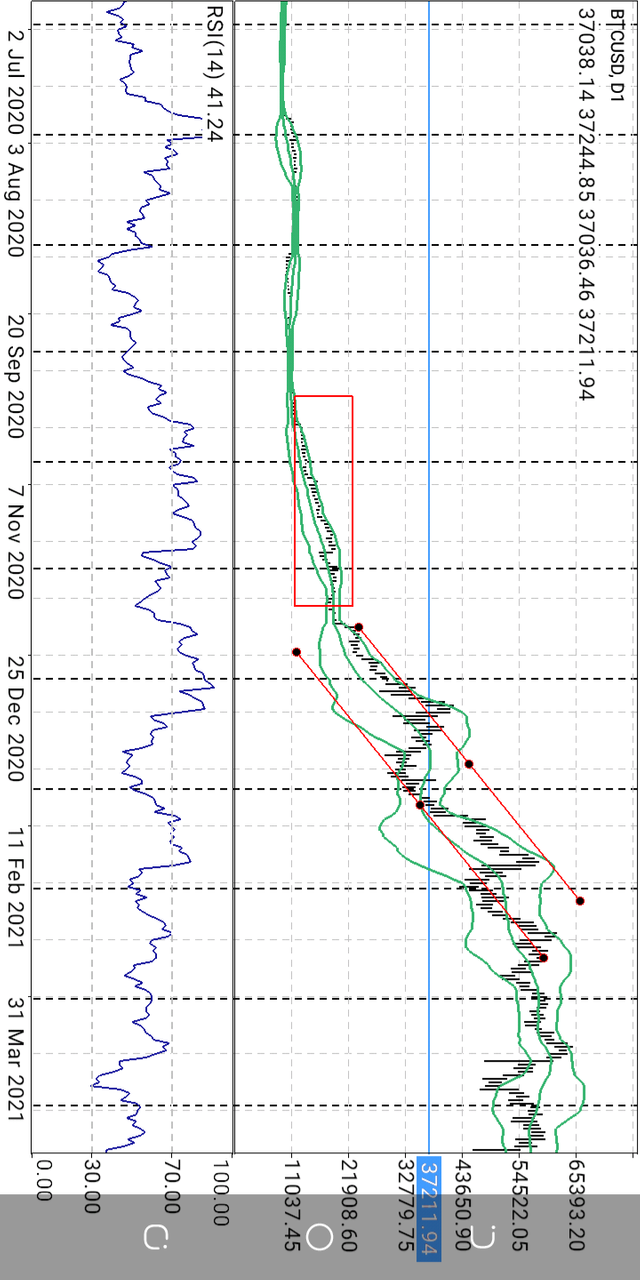
This is also applicable for a DOWNTREND Chart. If the candlestick is below the middle simple moving average and touching the lower band. This is a sign of oversold market and the price of such asset will fall.
Now that the candlestick are exceedingthe lower band then the market is in support .
We can use this to take positions to buy or sell in the market.
What is the best indicator to use with Bollinger Bands to make your trade more meaningful?
Like I said earlier the Bollinger Bands is not 100% accurate so it should not be used as the only indicator when trading.
The best indicator to use to make the Bollinger Bands indicator easy to take positions while trading is the RSI the RSI is the best indicator to use with the Bollinger Bands because the RSI reads the volume and Bollinger Bands follows price action. So when we combine the two together in a trade we will be sure of the position we are taking. Because the relative strength index(RSI) helps to determine overbought and oversold region.
If the RSI is indicating overbought and the Bollinger Bands is indicating low volatility, at that moment the price will drop and likewise if the RSI is indicating oversold and Bollinger Bands is indicating high volatility the market price of such asset will rise.
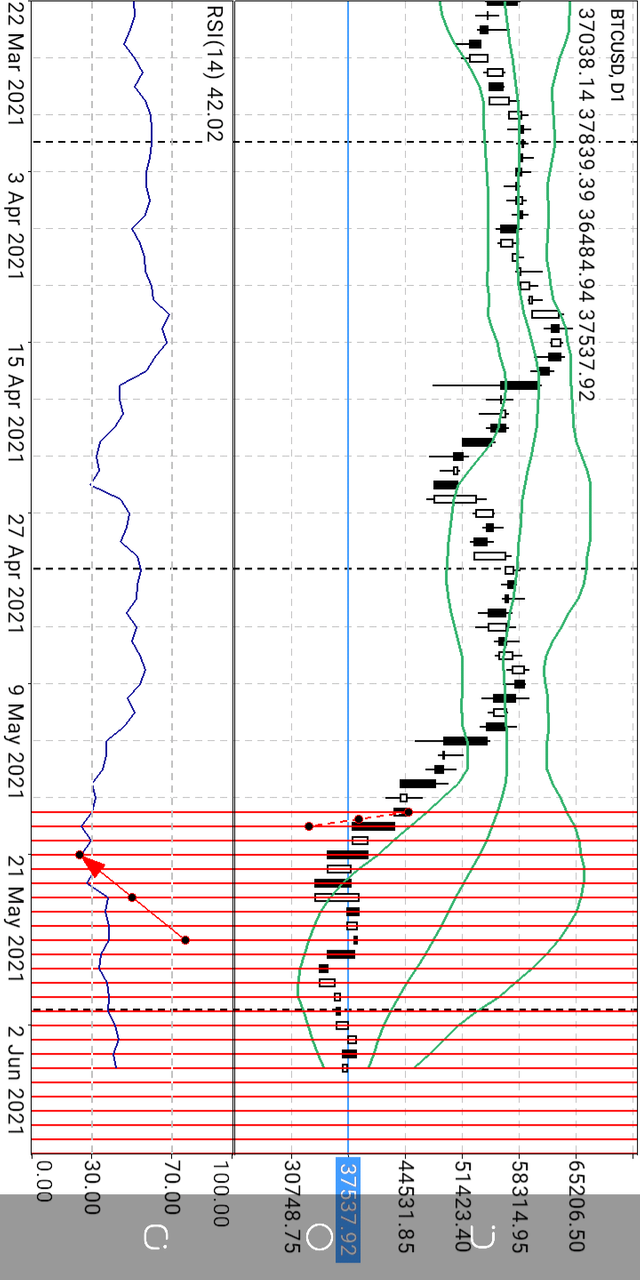
From the screenshot above we will see that the RSI is in the overbought sold but the Bollinger Bands is indicating high volatility. Withe the analysis the price of BTCUSDT will rise.
What timeframe does the Bollinger Bands work best on?And why?
The Bollinger Bands are better for short-term trading . So we can predict when the market is In high volatility and low volatility to predict the the movement. We won't be deceived when when the bands get too tight in higher time zone. So its better to trade Bollinger Bands in a short time zone like hourly and in minutes. It will be easier to use that way.
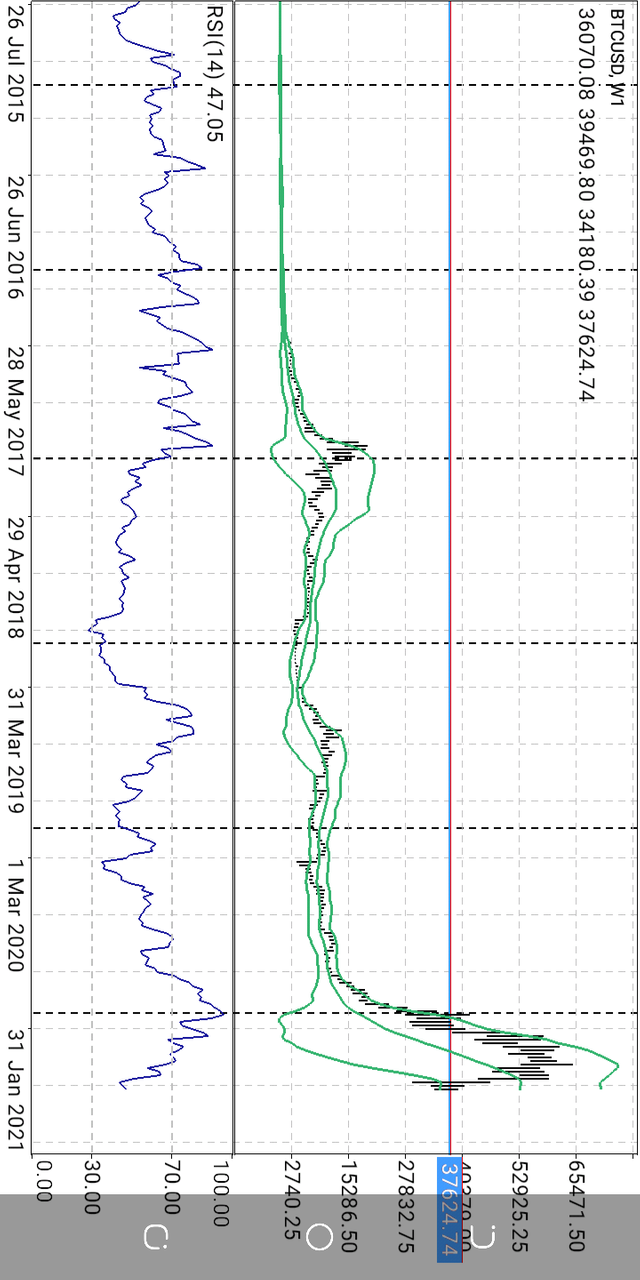
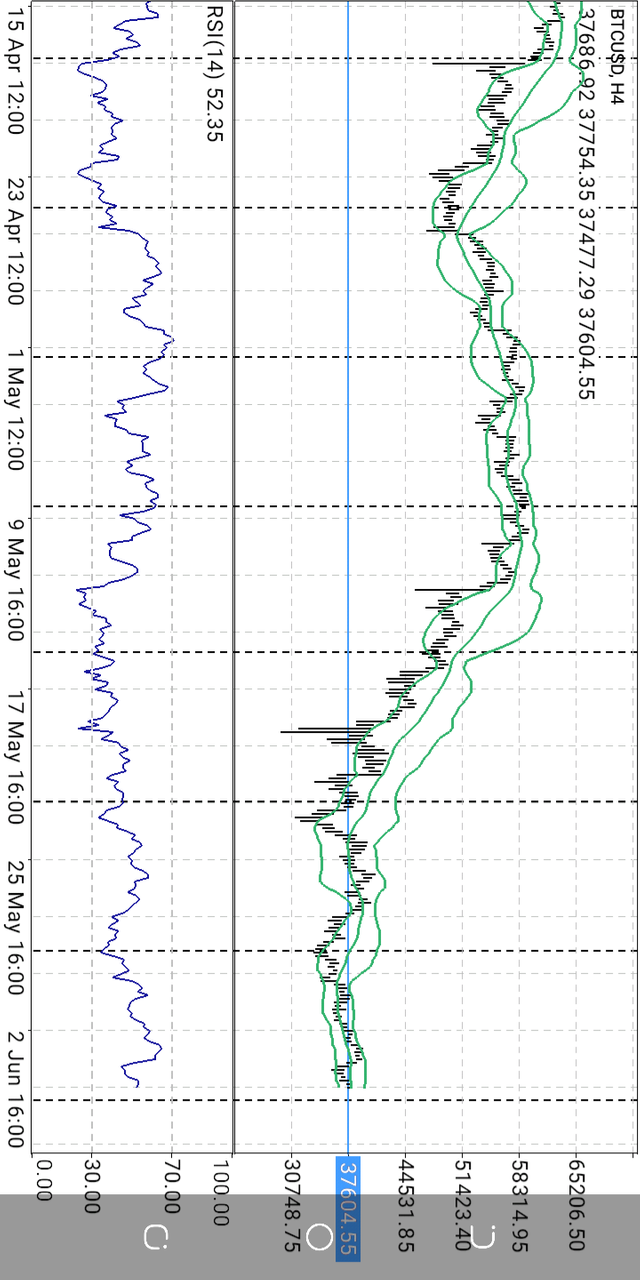
Let's compare the two screenshots the first one is a 4 hours time frame and the other one is a weekly time frame . We will see that the Bollinger Bands are indicating differently based on the time. So its best to use the Bollinger Bands in a shorter time frame.
Review the chart of any pair and present the various signals giving by the indicator Bollinger Bands.
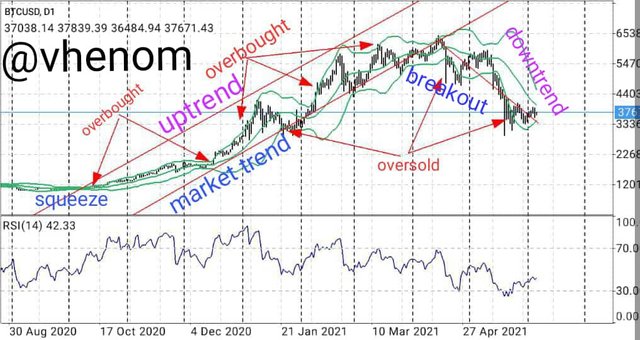
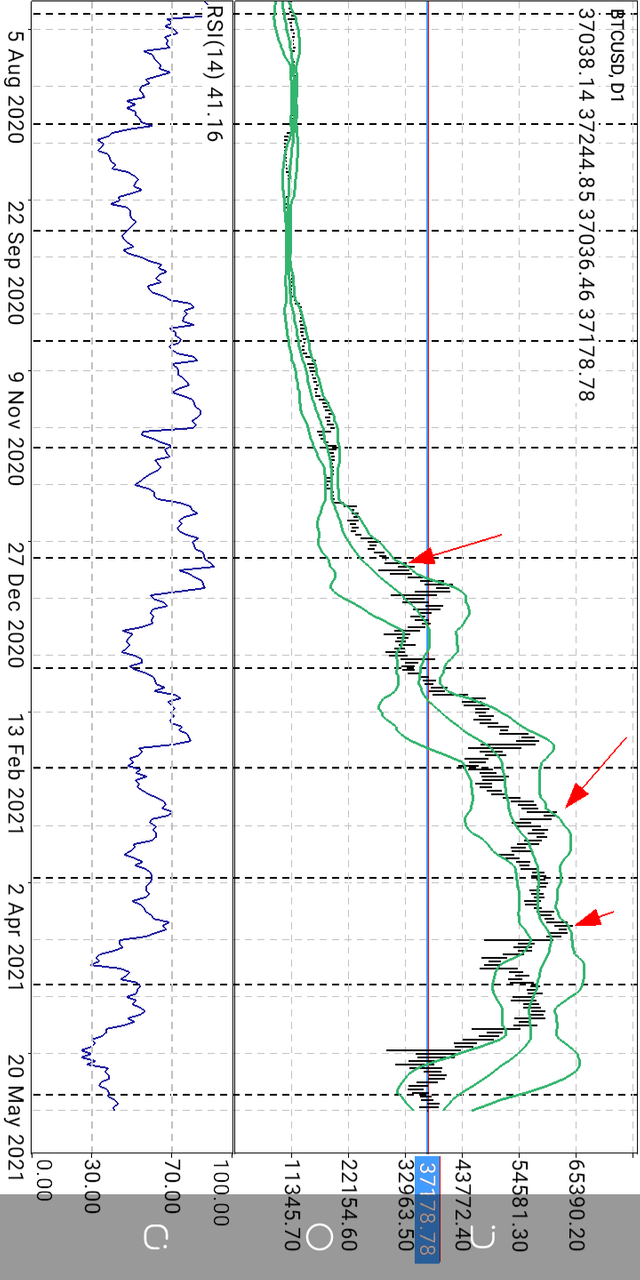
This is that BTCUSDT chart it will be use as a case of study in the course.
From the screenshot we can see the Bollinger Bands is squeezed at the bottom of the chart. Then gradually some candlestick started hitting the upper band and the volatility start increasing leading to an UPTREND.
During my the UPTREND we saw some overbought signal where the candlestick breakout of the upper band, we experience a marker Reversal in all cases of the overbought signals. The the UPTREND continues. In the market uptrend there are both oversold and overbought signals.
We also experience breakout in the market trend which leads to downtrend and fall in the market.
During the downtrend the candlesticks are breaking out from the lower band constantly leading to a downtrend/ bearish.
This is how to analyze the chart with the Bollinger Bands.
CONCLUSION
The Bollinger Bands is one of the most used Indicator, it is used to determine the overbought and oversold signal in the market trend.
Like every indicator is not 100% accurate the Bollinger Bands is not accurate also and it should not be used as the only indicator when trading. It should be used with other indicators to be able to predict the market perfectly.
CC: @kouba01
Hello @vhenom,
Thank you for participating in the 8th Week Crypto Course in its second season and for your efforts to complete the suggested tasks, you deserve an 8.5/10 rating, according to the following scale:
My review :
If you are a day trader, you will use Bollinger Bands on the lower time frame such as the time frame of 15 minutes or less.
If you are a swing trader, you will use Bollinger Bands on a daily or weekly time frame.
A very good article containing excellent explanations of all the points required which proves the wonderful research work you have done.
Thanks again for your effort, and we look forward to reading your next work.
Sincerely,@kouba01
Thanks for the review professor I will do better in next post.