Crypto Academy : Season 4- Week 2 : Technical Indicators
Introduction
Hello fellow steemians it's the second week of the steemit crypto academy season 4. This week course by @reminiscence01 in on Technical Indicators. We will learn what are technical indicators, how to add technical indicator to chart, the types/category of technical indicator.
LET'S GET STARTED


1. a)Explain Technical Indicators And Why It Is A Good Technical Analysis Tool.
Technical indicators are tools used by traders to analyze the behavior of the price of an asset. They are mathematical calculations of price movements represented graphically to help analyse the future of market price and it's trend.
Technical indicators are created to predict the future action of market price because the price of an asset won't remain the same. So to analyze the future action of these market price and trend, the technical indicators are provided. The technical indicators identify the changes in the market.
And for this future prices to be analysed, this technical indicators consider the previous price of the asset. Data like the closing price, opening price, high and low price over a certain period of time are considered by this technical indicators to identify the future movement of the price.
b) Are Technical Indicators Good For Cryptocurrency Analysis? Explain Your Answer.
From what I have learnt from previous classes, technical indicators are good for all cryptocurrency analysis. We get signals for trading when we add indicators to our chart. And this signals are mostly strong one that will add profit to our investment. With the help of technical indicators we get entry, exit, overbought and oversold signals, along with a market reversal signal.
The technical indicators help trades to filter out wrong signals preventing them from losing their investment. Note that using 2-3 technical indicators in a chart is the best so we can get a strong signal when all indicators are are showing same signal. Too many indicators won't let us have a clear view of the chart.
c) Illustrate How To Add Indicators On The Chart And Also How To Configure Them.
There are different ways to add indicator in different trading app or platform. I will be showing how to add indicators on metatrader4 trading app. I will show the step by step method of how to add indicator and how to configure the settings. I will add RSI and MA to my chart.
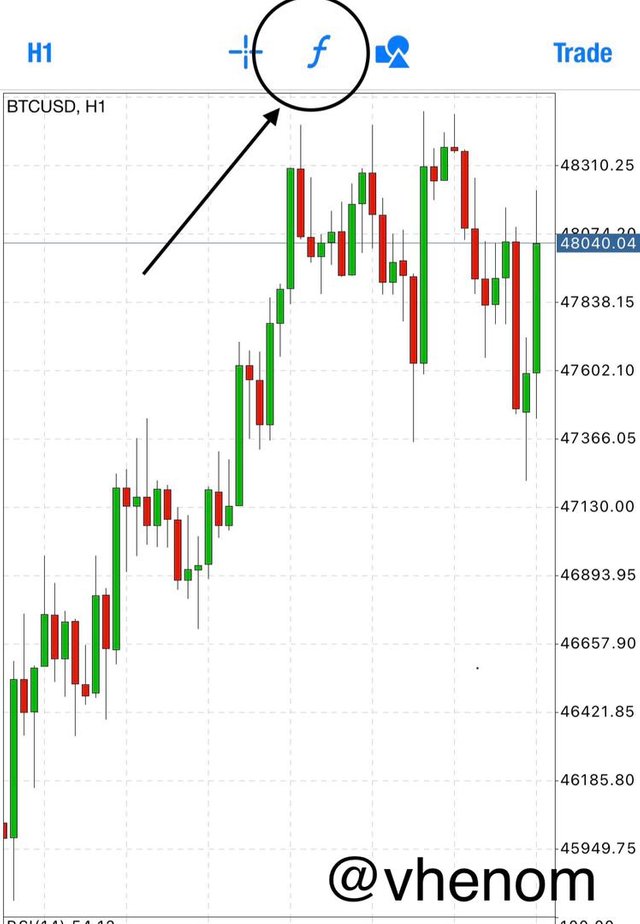
Step 1. After you have lunched the app you will see a f sign above your chart click on it.
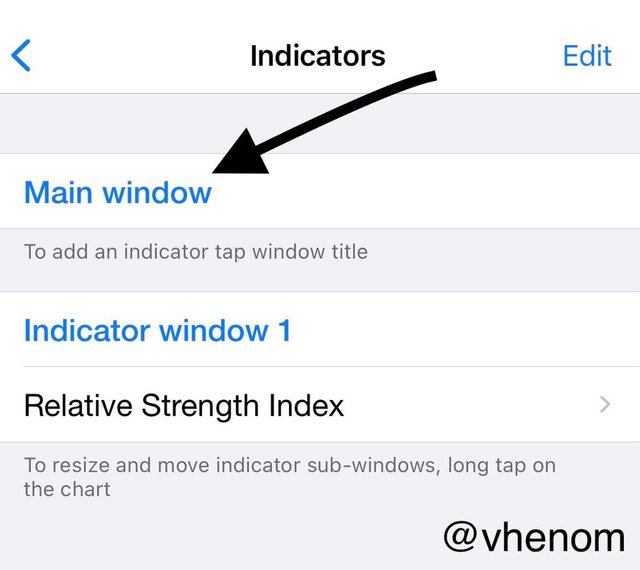
Step 2 You will then click on the main window option. Then you will be shown all the indicator in the metatrader4 trading app
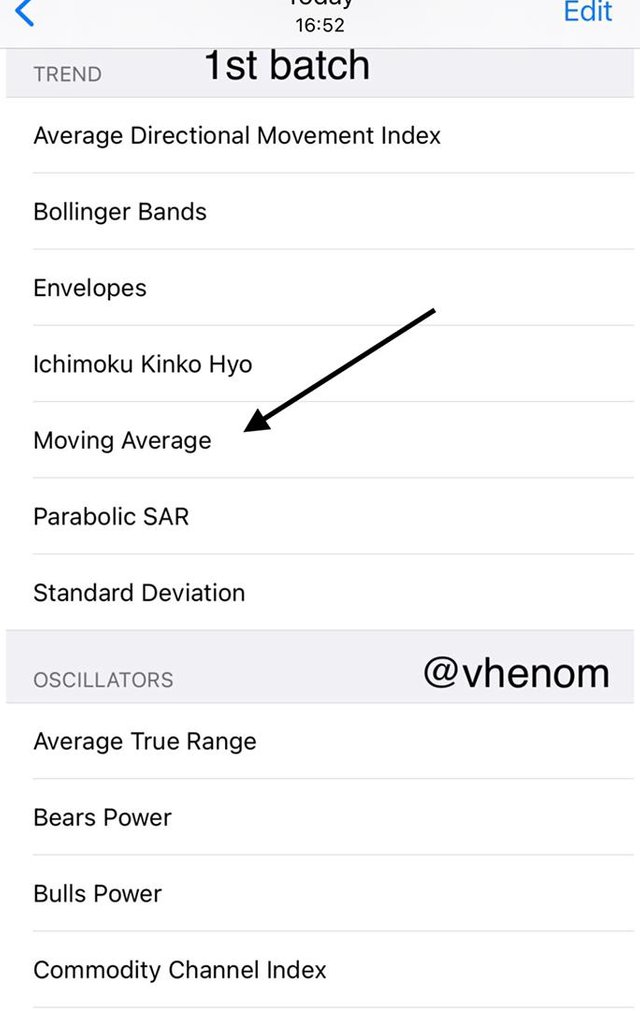
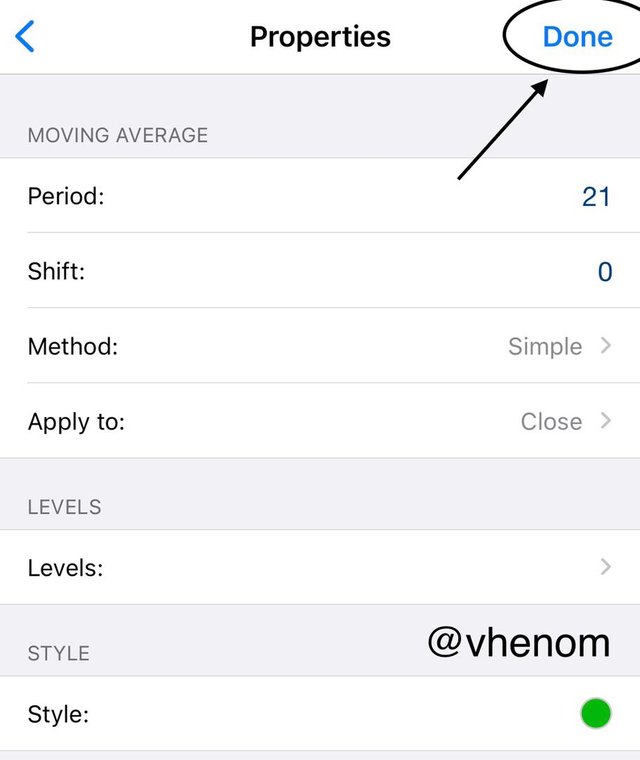
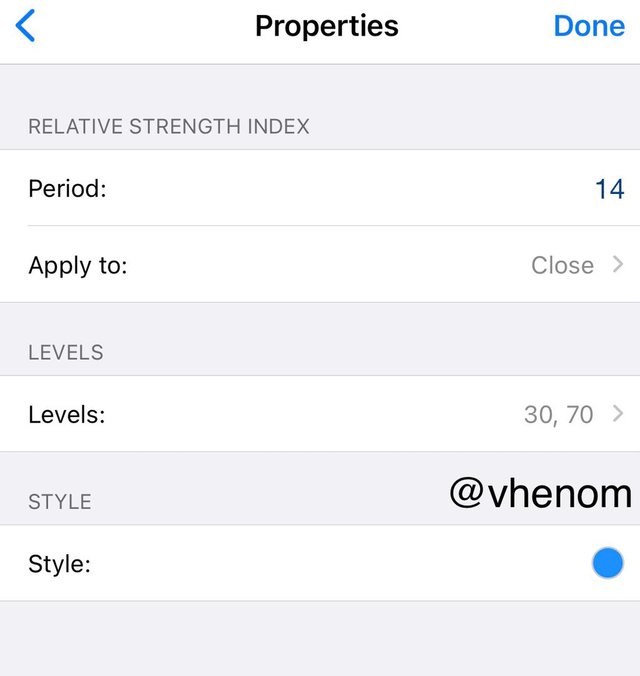
Step 3 You choose any indicator of your choice since am add RSI and MA to my chart I will select the indicator. Metatrader4 makes it easier you configure the settings to you liking immediately. So I added and edited the MA first
- Step 4 This is just the overview of how the indicator looks after we have added it to the chart.
2.a) Explain The Different Categories OF Technical Indicators And Give An Example Of Each Category. Also, Show The Indicators Used As An Example On Your Chart.
There are three categories of technical indicators namely
- Trend Based Indicators
- Momentum Based Indicators(Oscillators)
- Volatility Based Indicators
These are the three categories of indicators. All indicator lies under this three categories. Now let's look at their functions and examples of indicators under this categories.
Trend Based Indicators
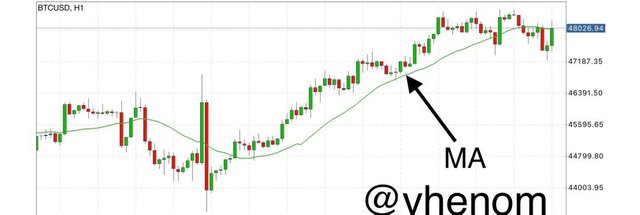
This indicators are used to analyze the trend in the market. They follow the market trend making it easy to analyze the price. This indicators are always on the chart moving with respect to the market price.
Trend Based Indicators show the market trend easily. When the market is going in an UPTREND we will get a signal likewise when the price is falling we will get the signal too this indicator give different signals with respect to the action of the price.
Below is a screenshot showing some examples of trend based indicator from my metatrader4 trading app.
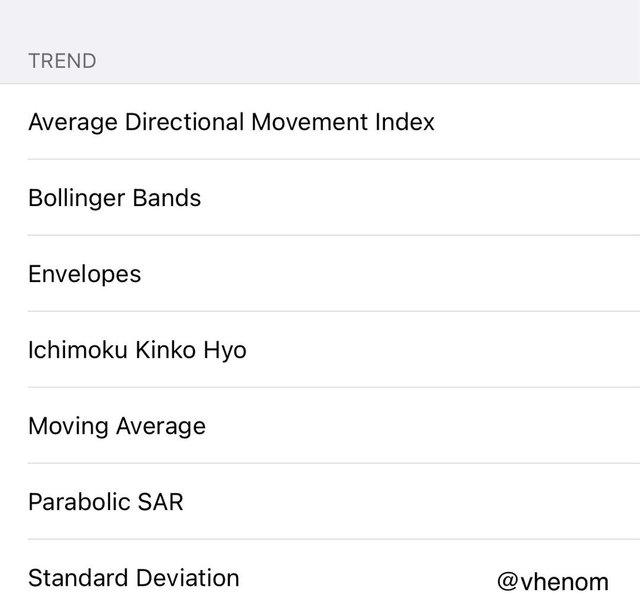
I will use Moving Average MA as an example. See screenshot below.
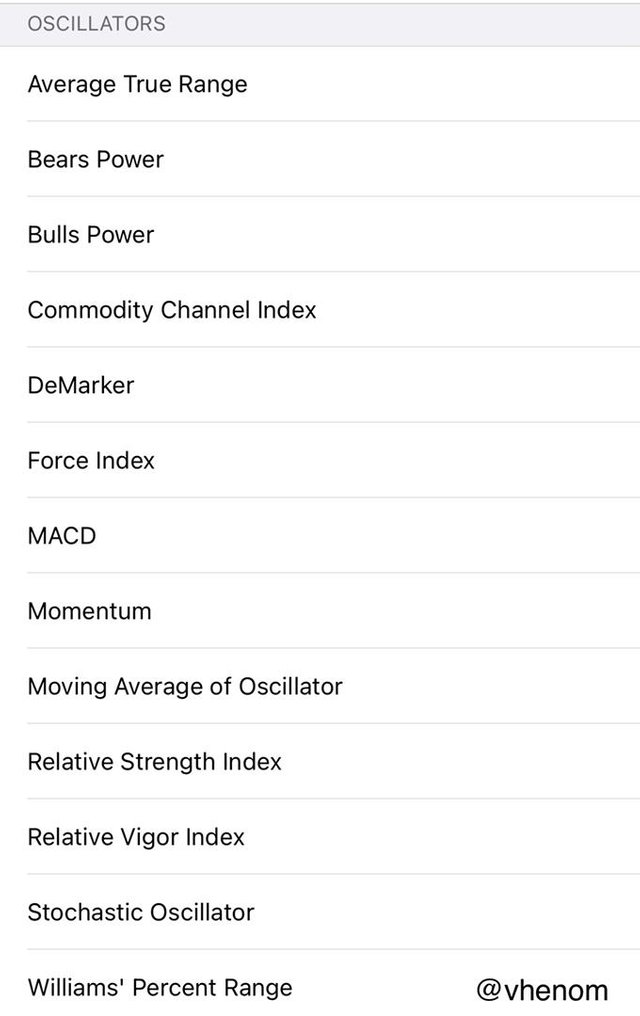
Momentum Based Indicators
This indicators are also known as Oscillators. They are used to know the strength of the market price. This indicators also show the trend of the market either bearish or bullish trend. This indicators tell when the price of an asset is oversold or overbought.
We all know that no trend can stay forever there will be a point where the trend will have to change with the help of oscillators we can get a reversal signal quickly. Giving investor better opportunity to trade when the trend is still young.
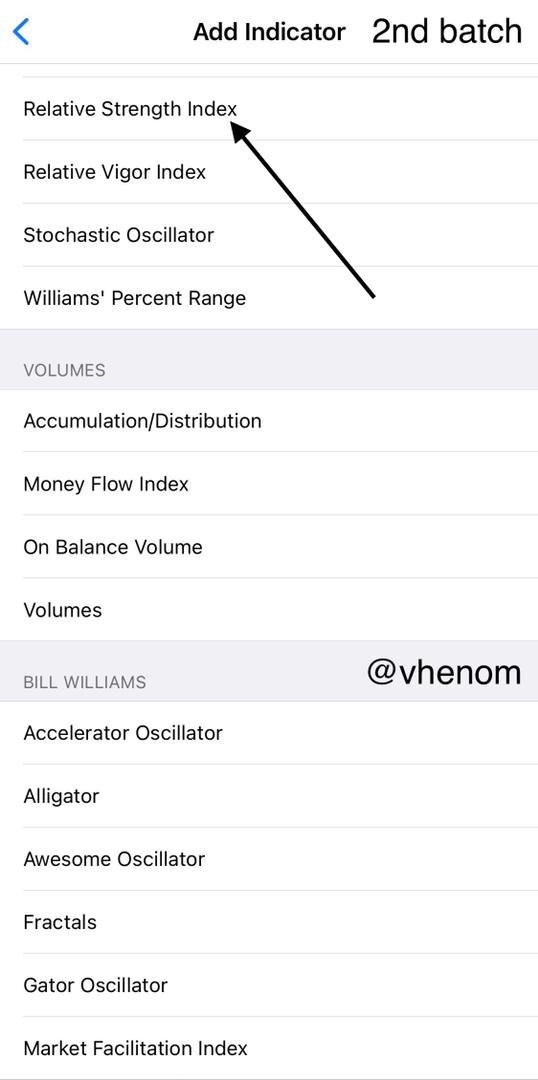
Below is a screenshot from metatrader4 trading app showing some examples of oscillators.
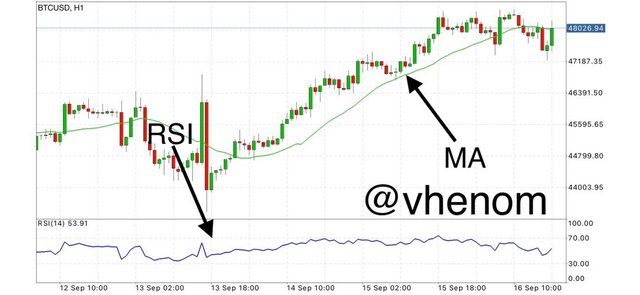
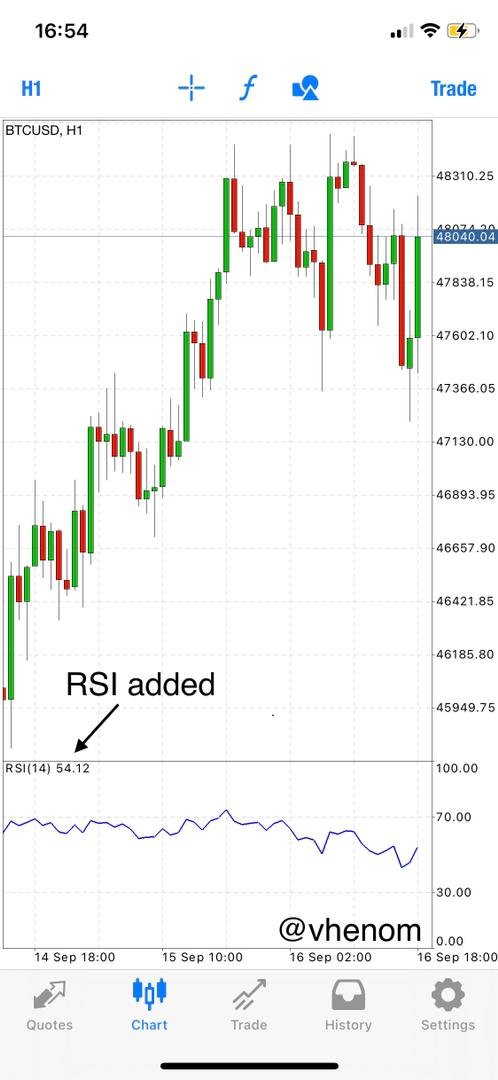
I will add RSI to my chart to show an example of oscillator. Below is a screenshot of RSI added to my chart.
 .
.
When ever the RSI crosses the 70 in the scale then we say the market is overbought we can start preparing for a sell trade and likewise when the RSI goes below 30 the market becomes oversold. We can start closing our sell orders.
Volatility Based Indicators
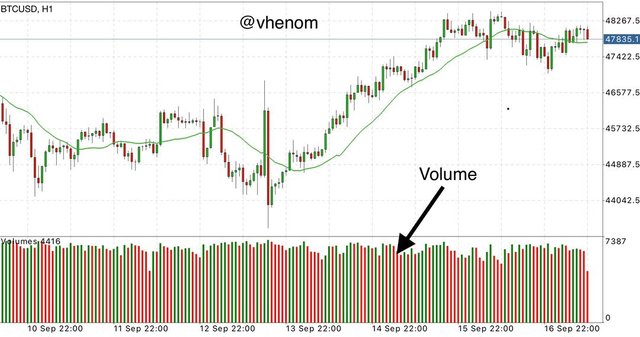
Volatility Based Indicators as the name implies, are indicator used to know the volume of the market. They are used to analyze the volatility of the market. With the use of this indicator we can analyze the swing high and swing low in the market. It give trader better trading opportunities to trade at this swing points.
This indicators can be used to know the volume of the market. How high it is or how low it is. Below is a screenshot showing some examples of the Volatility Based Indicators.
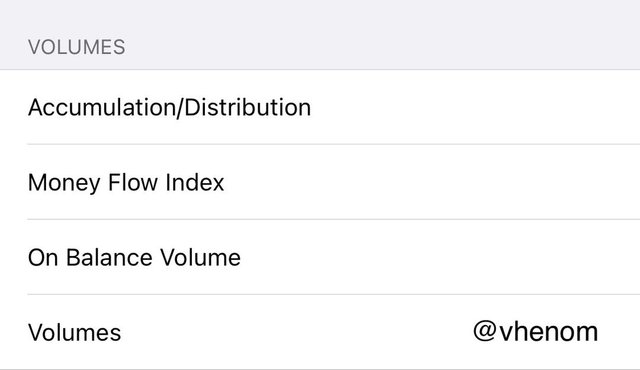
I also added an indicator called volume to my chart to know the volume of the market. See screenshot below
2.b) Briefly Explain The Reason Why Indicators Are Not Advisable To Be Used As A Standalone Tool For Technical Analysis.
With all the data above the indicator gives signals for future purposes. Despite the way these indicators work they are not 100% Effective because some action happens in the market that sometimes oppose the signals given by an indicator. So if used alone we can lose our funds.
But when we add other indicator (2-3 indicator) to our chat we get more chance of filtering out false signals. So as a trader it's not advisable to use one single indicator for analysing the future action of price of an asset.
2.c) Explain How An Investor Can Increase The Success Rate Of A Technical Indicator Signal.
Technical Indicators are added to trading apps to help traders/ investment to manage there risk. So with the proper indicator and analyse will help investors to increase success rate. Success rate doesn't mean they won't lose some of their investment bacause there are some time the market will go against your analysis but the profit should be more than the loses.
With the use of technical indicators and a good risk management (risk - reward ratio) I think the rate at which a trader makes profit should increase.
For instance, we want to trade with RSI indicator and moving average indicator. We need a perfect buy position or I will use the RSI to pick my signal. I identified the oversold signal of the RSI as soon as the indicator cross 30 it went back the I place my trade. See screenshot of the analysis below
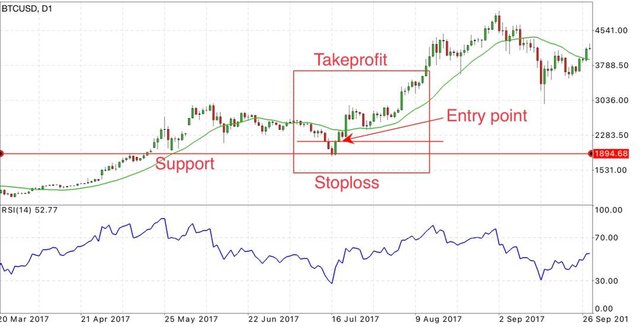 . I used 1:2 risk to reward ratio to get more profit. We shouldn't be greedy as a trader. So trader set higher Stoploss so the market won't hit their stop loss bit it's a bad idea because you will keep losing your investment.
So when a trader analysis the chart very well with any technical indicators of his choice and he see the the signal is strong he should forget to set a risk - reward ratio in terms of Stoploss and take profit. Before placing the order. With this investors will be successful with their trade. And one more thing you shouldn't set what you can't afford to lose as your Stoploss.
Conclusion
Technical indicators are mathematical calculations of price movements represented graphically to help analyse the future of market price and it's trend.
Technical indicators are tools used by traders to analyze the behavior of the price of an asset.
Data like the closing price, opening price, high and low price over a certain period of time are considered by this technical indicators to identify the future movement of the price.
Technical indicators are created to predict the future action of market price because the price of an asset won't remain the same
Hello @vhenom, I’m glad you participated in the 2nd week Season 4 of the Beginner’s class at the Steemit Crypto Academy. Your grades in this task are as follows:
Observations:
The question was
Recommendation / Feedback:
Thank you for completing your homework task.
Thanks for the review I will do better next time