[Heikin-Ashi Trading Strategy]- Steemit Crypto Academy | S4W2 | Homework Post For @reddileep
Introduction
Hello guys it's the 2nd week of the steemit crypto academy season 4. This week course by professor @reddileep is on Heikin-Ashi Trading Strategy. We will learn how to use this technique to trade a crypto asset.
Let's get started

1- Define Heikin-Ashi Technique in your own words.
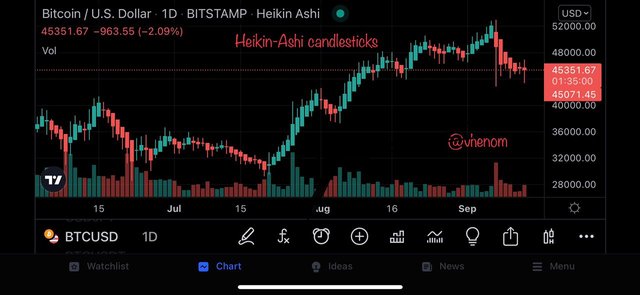
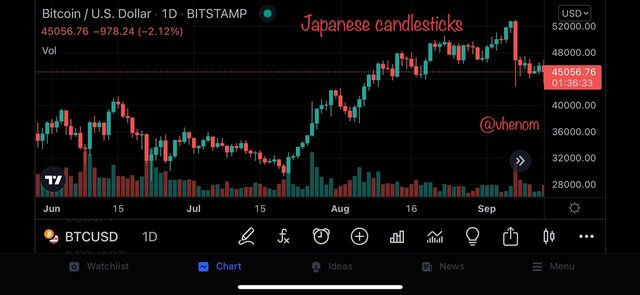
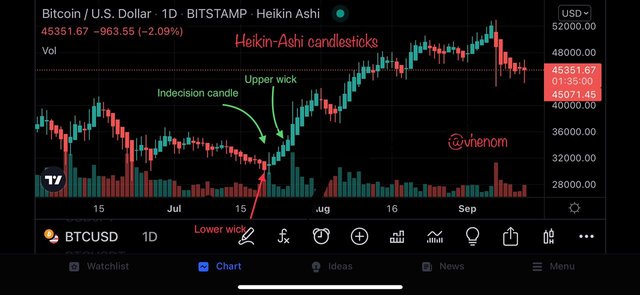
The Heikin-Ashi Technique is the graphic representation of the price of an asset. The Heikin-Ashi candles is a type a candlestick that is used to represent a filtered price of and asset avoiding the noise in the market. It's different from the way the Japanese candlestick represents the price. The Heikin-Ashi candles considers the open, close, high and low of the previous candlestick.
The Heikin-Ashi candles indiates the trend of the market better than the Japanese candle. It represent strong trend in the market other than the Japanese candle that represents every slight change in the market.
There are ways to calculate all the data the Heikin-Ashi candles consider in representing data(open, close, high and low). The Heikin-Ashi chart looks smoother then the Japanese candlestick. The Heikin-Ashi formula is based on two- period average which make it smoother.
You will notice the the Heikin-Ashi candlestick are very smooth it's because it filter out market noise which the Japanese candlestick can't.
Differentiate Between The Traditional Candlestick Chart And The Heikin-Ashi Chart
Firstly, before I go ahead stating the differences between the traditional Japanese candlestick and the Heikin-Ashi Candlestick let take a look in the difference in the chart. The way their data representation looks
| Japanese Candlestick Chart | Heikin-Ashi candlestick Chart |
|---|---|
| 1 The graph represent all the noise in the market | The graph avoid all the noise market. |
| 2 Market trend is hardly found in the market | market trend are easily identified in the market. |
| 3 The formation of the candlestick doesn't require any calculations a new candle is formed above or below the previous candlestick | conversely the formation of a new candle requires calculations. You can see in the chart above that some new candlestick form in the middle of the previous candlestick. |
| 4 Hardly get signals for trading | some candlestick shows some signals for entry point. |
This above difference makes the chart of the traditional Japanese candle and the Heikin-Ashi candles different.
3- Explain the Heikin-Ashi Formula
The Heikin-Ashi Candlesticks consist of 4 data that are considered before the formation of an new candlestick. Which are
- Open
- Close
- High
- Low
How To Calculate The Open
The opening price of the previous candle and the closeing price of the previous candle are added together and divided by two that will be the opening price of the new candlestick.
Open = (Open price of previous candle + close price of previous candle)÷2
How To Calculate The Close
To Calculate the close of the candlestick we add the opening price, close price , high price and the low price together the divide it by 4
Close = (open + close + high + low)÷4
How To Calculate The High
This is the highest/maximum value the current candlestick gets to.
High = the maximum value of the current candlestick
How To Calculate The Low
This is the lowest/ minimum value the current candlestick gets to
Low = the minimum value of the current candlestick
Now using the formula to calculate the Heikin-Ashi candles
How To Calculate Heikin-Ashi
- We will use one period to calculate the first Heikin-Ashi candles. Using the formulas, we will the open and close to create the first Heikin-Ashi Open. Use the open, close high and low to create the first Heikin-Ashi close. The high of the period will be the first Heikin-Ashi high and the low of the period will be the first Heikin-Ashi low.
- Since we have calculate the first period Heikin-Ashi we can use the formula to compute the Heikin-Ashi candles.
- To calculate the second candle add the prior open and close together then divide it by 2 to get the opening of the new candle
- We will use the current open,high, low and close to get the new close.
- To get the next high use the maximum value of the current candle
- To calculate the next low use the minimum value of the current period.
With the formula we can keep computing the Heikin-Ashi Candlesticks.
4. Graphically Explain Trend And Buying Opportunities Through Heikin-Ashi Candles
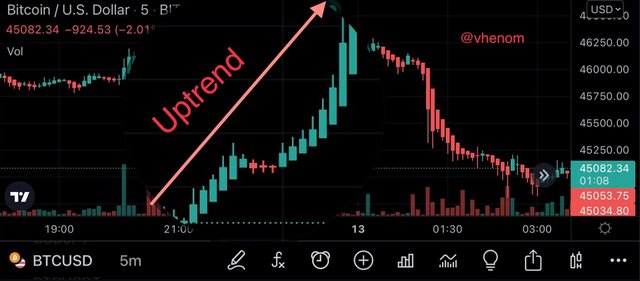
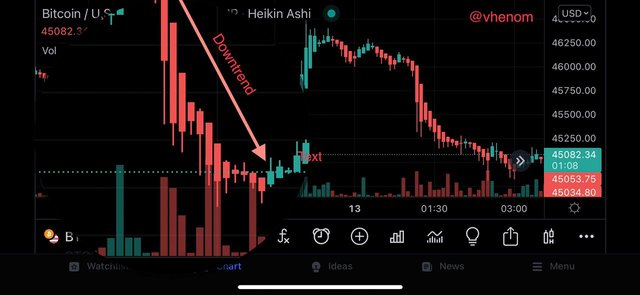
When using the Heikin-Ashi Candlesticks the trend are easily spot bacause it doesn't represent the noise in the market. We will see a clear chart of bullish trend and a clear chart of bearish trend unlike the traditional Japanese candlestick which is often interrupted by the noise in the market.
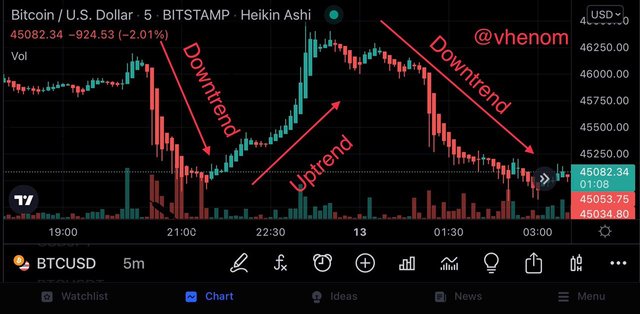
The candlesticks only change it's trend when the trend reverse is strong. And since the next candlestick can be calculated / computed we can find a gap in the Heikin-Ashi Candlesticks. Even when the market is very volatile. It will always give information of the strong trend.
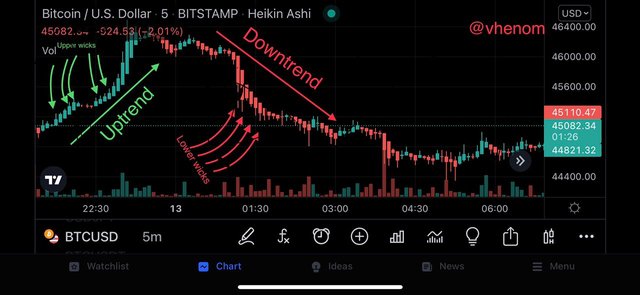
With the Heikin-Ashi candles we can get signals for trading. Using the candle we can get strong signals for uptrend and downtrend. For a buy signal a green candle with no shadow/line below is used for a buy opportunities. While a red candle with no shadow / line on top of it are used for sell opportunities. See screenshot below.
5. Is It Possible To Transact Only With Signals Received Using The Heikin-Ashi Technique? Explain The Reason For Your Answer
After getting the hammer signal from the candlestick and other signals from the Heikin-Ashi candlestick. We can't use them in trading because am sure we have learnt from previous lectures that no indicator is 100percent effective.
So we should consider using other indicator to support the signals gotten from this candlestick to confirm the signals. We can use indicator like Exponential Moving Average, RSI, Bollinger bands and other indicators.
The buy and sell opportunities given by the Heikin-Ashi candlestick are strong one but sometimes some action can be taken in the market by other traders that can change the trend afterwards.
For example we might have gotten a buy signal from the market and a whales comes into the market and place a sell order with large volume the trend will obviously change to bearish but we might not get this bacause the Heikin-Ashi candlestick won't react fast to this change but if we are using other indicator to support it we will get it immediately and know what to do.
Take a look at the screenshots above despite the lower wick signal showing a downtrend you will see the the trend later changed afterwards.
6. By using a Demo account, perform both Buy and Sell orders using Heikin-Ashi+ 55 EMA+21 EMA.
Before placing the trade I first added the ema to my chart the I edit the settings to 55 length and 21 length. After adding the ema I started analysing the chart.
Buy Order
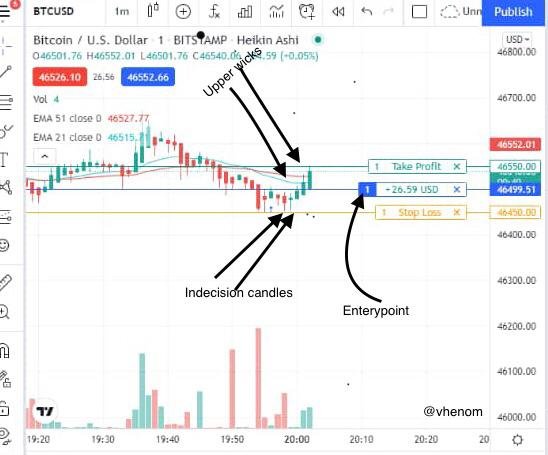
There are many signal in the market I don't want to run into the market so I wait for a perfect signal. You can see the indecision candle and after a bullish candle follows and the EMA is about to twist again . Showing a strong up trend. I begin to edit my trade putting stop loss and take profit in the ratio of 1:1 risk to reward ratio.
After the end of the first bullish candle I place the buy order. See all my positions in screenshot below
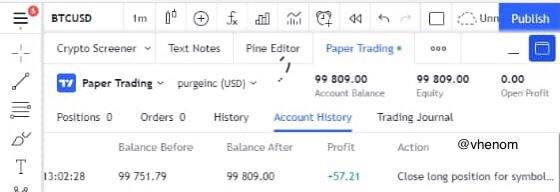
After few candles it hit my take profit. Below is the screenshot of my profit.
Sell Order
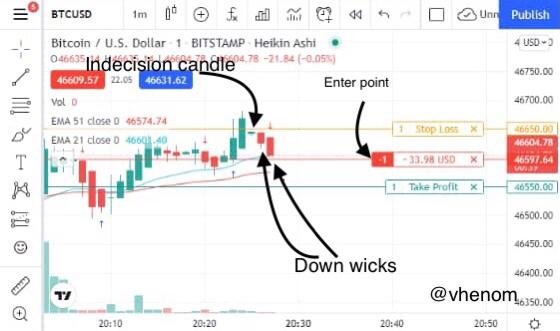
I waith for the indecision candle and after a bearish candle forms and the EMA is about to twist again . Showing a strong downtrend signal. I begin to edit my trade putting stop loss and take profit in the ratio of 1:1 risk to reward ratio.
After the end of the first bearish candle I place the sell order. See all my positions in screenshot below
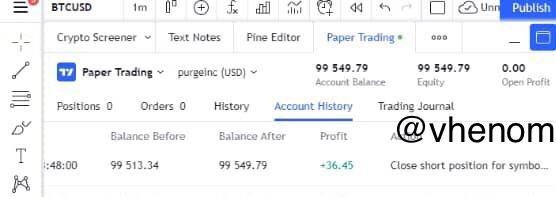
After few candles it hit my take profit. Below is the screenshot of my profit.
Conclusion
The Heikin-Ashi Technique is the graphic representation of the price of an asset.
The Heikin-Ashi candles is a type a candlestick that is used to represent a filtered price of and asset avoiding the noise in the market. It's different from the way the Japanese candlestick represents the price.
The Heikin-Ashi candles considers the open, close, high and low of the previous candlestick.
CC @reddileep
Note: all screenshot from tradingview mobile app and tradingview