Crypto Academy Season 3 | Intermediate Course: Crypto Assets and the Random Index (KDJ)
INTRODUCTION
Hello fellow steemians this week topic by profession @asaj is on technical analysis KDJ indicator also known as Random Index indicator.

Let get started
1. In your own words define the random index and explain how it is calculated
What is Random Index
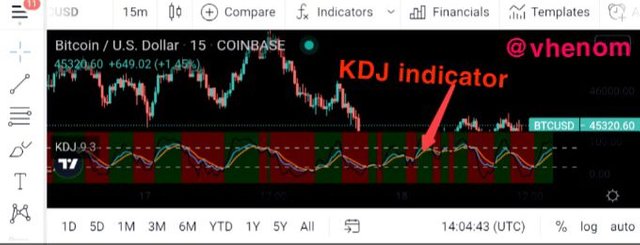
Random index indicator also know as KDJ indicator is a technical analysing tools that helps traders to predict a good entry and exit point, the market trend and trend reversal. It's a new indicator similar to the stochastic oscillator. It is made up of three lines which are the K line, D line & J line. The K and D line works just like the stochastic oscillator lines. The J line is the divergence from the K value from the D value. The J line is the line differentiating this two indicators. Whenever this three line crossover we see this as a strong signal.
The J line can give over bought and over sold signals just like the RSI indicator. When the line goes above 80 then the market is over bought and when it below 20 the market is over sold. The K and D lines also determines movement of buying and selling in the market. The random index helps predict trend, entry and exit point along with reversal signal.
How is Random Index Calculated
To calculate the Random Index line we have to first calculate the RVS value of certain period. Then we calculate the K and D value follow by the J value of n period.
Note number of days / Period will be represented by n. Close of the the day by Cn, highest value of the day by Hn and lowest value of the day by Ln
n period RVS= (Cn - Ln) /(Hn - Ln)× 100
That's for the RVS now moving to the K and D value for nth period.
We have,
K value of nth days = 2/3 × k value for previous day + 1/3 × RVS of the nth day
D value for nth days = 2/3 × D value for previous day + 1/3× RVS of the nth day
Note: if there is no previous day value for K and D, we can use 50.
J value of nth days = 3 × k value of the day - 2 × D value of the day.
That's all on how to calculate the Random Index lines. For any number of days you want to calculate you can always replace n with the number of days. For instance if we want to calculate for 2days we say n= 2. Then we calculate.

2. Is the random index reliable?
As we have learnt in previous classes all indicator are not 100% effective including the random index indicator. Because it also gives false signals. So the indicator should not be 100% depended on to give signals. We can used other indicators to support this indicator like the moving average indicator, ADX indicator and many other indicators. To get signals before entering a trade.
3. How is random index added to a chart and what are the parameters?
To add random index indicator to our chart is just same process on how we add every other indicators to our chart.
I will show the step by step method on how I added the indicator to by chart on tradingview.
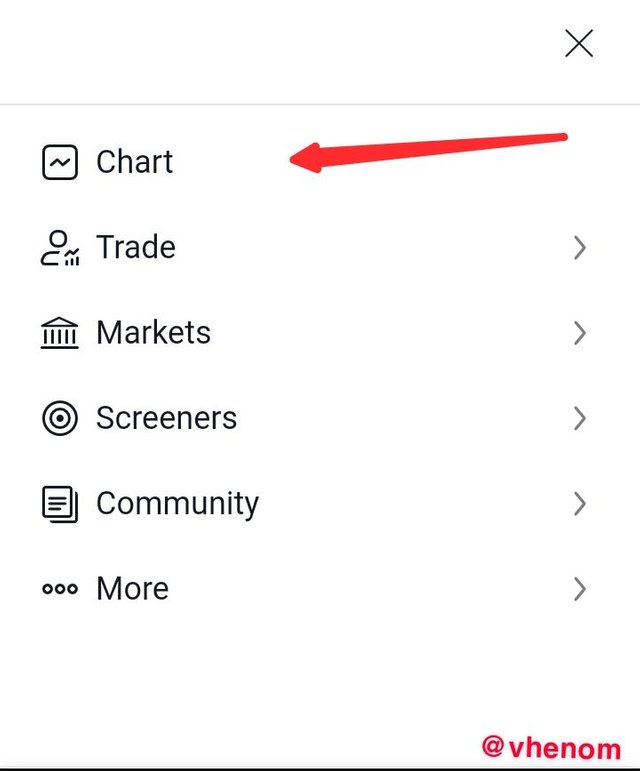
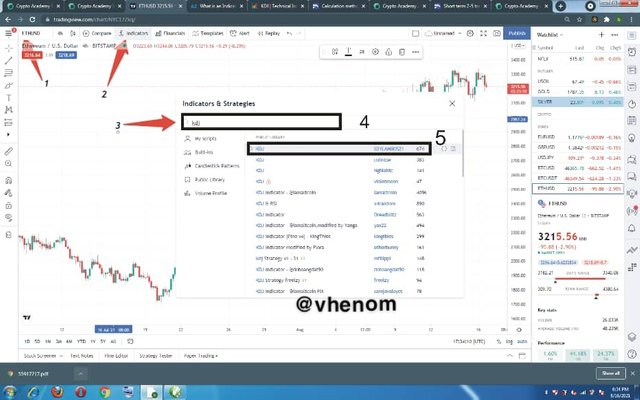
First I launch the tradingview website. Then I clicked on chart icon
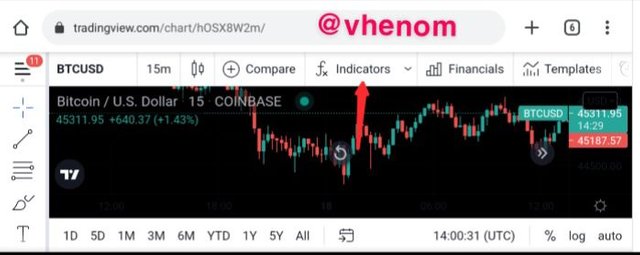
After clicking on the chart icon it loaded my chart. Now I want to add the indicator to the chart I clicked on the indicator icon above the chart
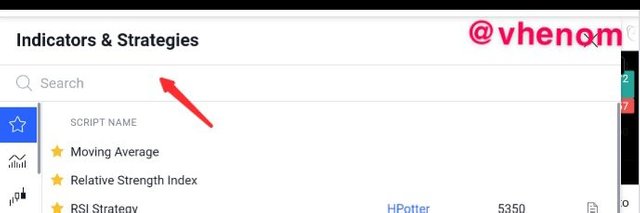
Now that I have click on indicator you can see the search box that's where you are going to search for any indicator you want.
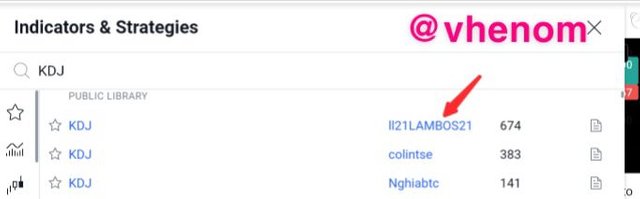
Since am adding KDJ indicator I searched for KDJ and you can see that there are different options for KDJ I choose the one with II2ILAMBOS21 because it has the highest ranking.
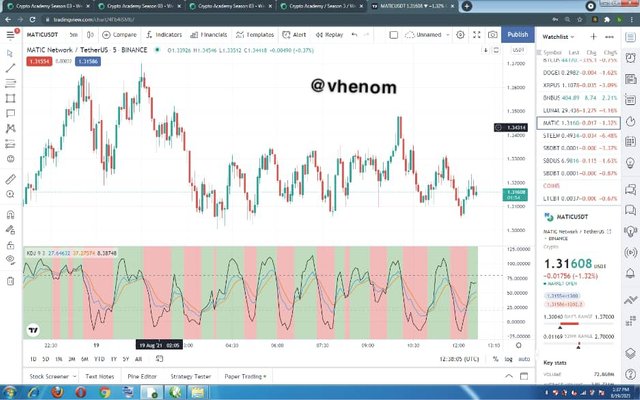
Finally the indicator was added to my chart I also stared the indicator to add it to my favourites.
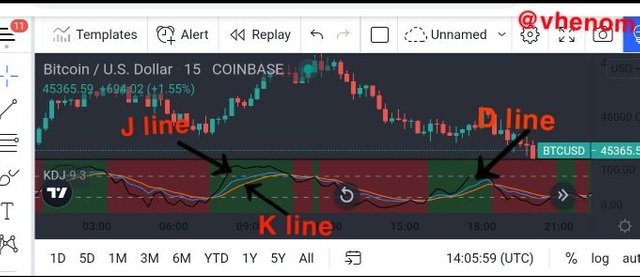
Below is the screenshots where I identify the three lines. The indicator setting remains in default.
Some of the signals given by random index indicator
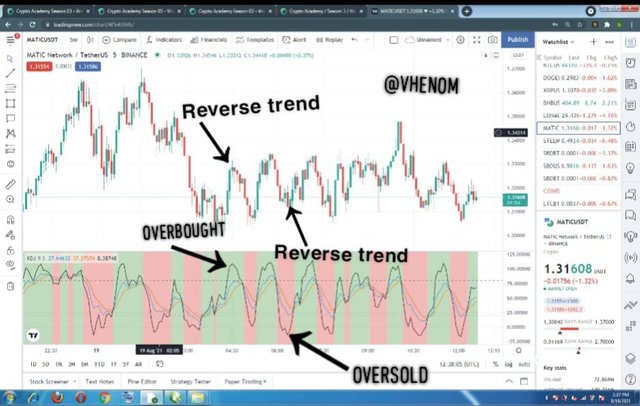
Overbought signal
We get an overbought signal when the J line rises above 80. Once this point is attained we should expect a trend reversal. We see that both the indicator and the price falls after the overbought signal. This is an entry signal for a sell order and an exit signal for buy trades.
Oversold Signal
When the J line falls below 20 we say the market is over sold. After some minutes or immediately the trend of the market is reversed. Giving an entry order for buy trades and an exit order for sell trades.
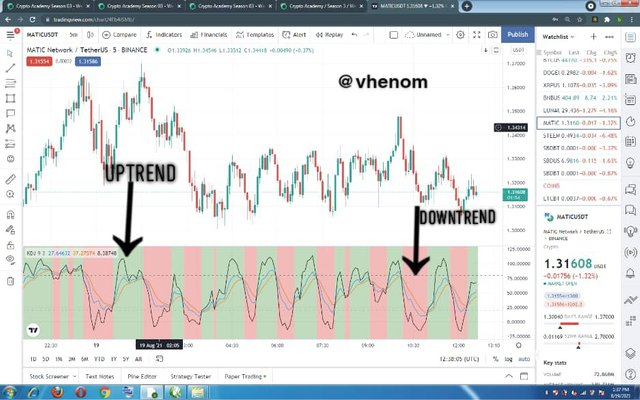
Uptrend
Another signal shown by the random index indicator is a uptrend signal where the background of the indicator turns green. Onces we noticed this we know that an uptrend is about to start and we can place a buy order.
Downtrend
Similar to the up trend signal, the random index background changes to red when a down trend is about to start. When we get this signals buyers can exit their position and sellers can place a sell order.
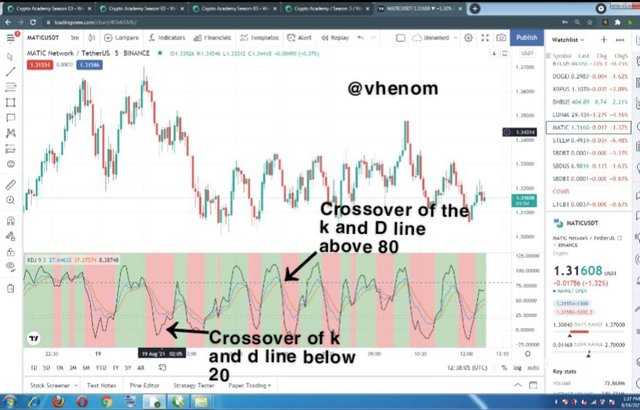
Crossover of the K and D lines
When the k line crossover the D line from the top above 80 and the J line starts falling this is a sell signal. But when the K line crossover the D line below 20 and the J line start increasing then we have a buy signal.
I hope we have all seen how the KDJ indicator gives it's signals and all the signals it gives.
4. Difference between KDJ, ADX and ATR
Before I state the differences between the three indicators let me first say something brief about the ADX and ATR
ADX
Average Directional Index indicator is used to determine the strength of the trend of a crypto market. The ADX line ranges from 0-100 the value at which the line is is tell how strong the trend of the market is
0-25 means that there is no trend
25-50 means that there is a trend/ new trend
50-75 means very strong trend
75-100 means Extremely strong trend
ATR
Average True Range Indicator is an indicator categorized under volatility base indicator. This indicator b is very much like the Bollinger band. This indicator is a single line indicator. It doesn't show the trend in and way it only how much price moves in a given time frame. We can use e this indicator to determine the Stoploss point in a trade.
The major difference between the three indicator are in the table below.
| KDJ | ADX | ATR |
|---|---|---|
| This is a three line indicator | This is a single line indicator | This is also a single line indicator |
| Tells the trend of the market | measures the strength of the trend | measures the volatility of the market |
| Indicates overbought and oversold market | doesn't show oversold and overbought | doesn't indicator oversold and overbought signals. |
| Should be combined withe another indicator like ATR and ADX to know the volatility and strength of the market | should be combined with RSI or KDJ indicator for better signals | should be combined with moving average so as to get good entry point |
5. Use the signals of random index to buy and sell any two cryptocurrencies.
Below are the screenshots rectifying the buy order I placed using the random index indicator to pick my signals.
Using both the oversold and crossover of the K and D line signals I placed a buy order.
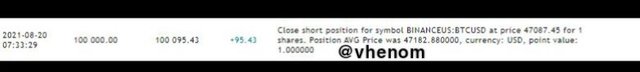
This screenshot below is after the trade is closed. Below is the final set up and my profit after the trade.

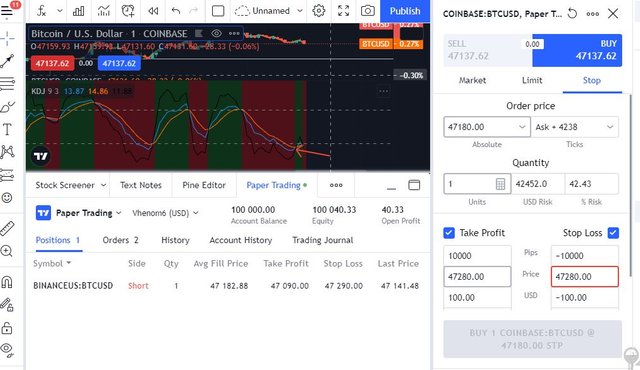
That's it for the buy order no moving on to the sell order
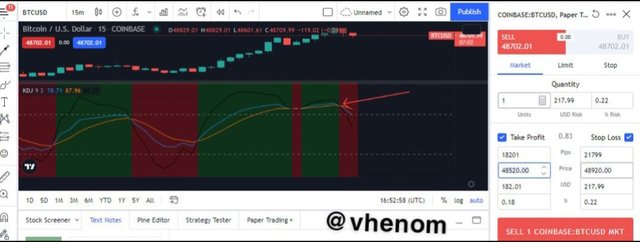
I used the downtrend , overbought and the crossover of the K and D line signals you can see in the screenshots below that the J line is above 80 and the color of the background of the indicator is red so I placed the sell order. Before then I modified my trade managing risk before entering the trade.
This is the screenshots of the profit from the trade
Conclusion
Random index indicator is also know as KDJ indicator is a technical analysing tools that helps traders to predict a good entry and exit point, the market trend and trend reversal. It is similar to the stochastic oscillator. It is made up of three lines which are the K line, D line & J line. The K and D line works just like the stochastic oscillator lines. The J line represent the divergence from the K value from the D value.
The J line can give over bought and over sold signals just like the RSI indicator. When the line goes above 80 then the market is over bought and when it below 20 the market is over sold.
CC @asaj