Crypto Academy Season 03 - Week 06 | Advanced Course - Trading Liquidity Levels The Right Way
INTRODUCTION
Hello fellow steemians it's the 6th week of the season 3 crypto academy this season has been great so far with interesting courses from the professor. This week course by @cryptokraze is on trading strategy. Trading liquidity levels the right way.

Let get started
What is your understanding of the Liquidity Level. Give Examples
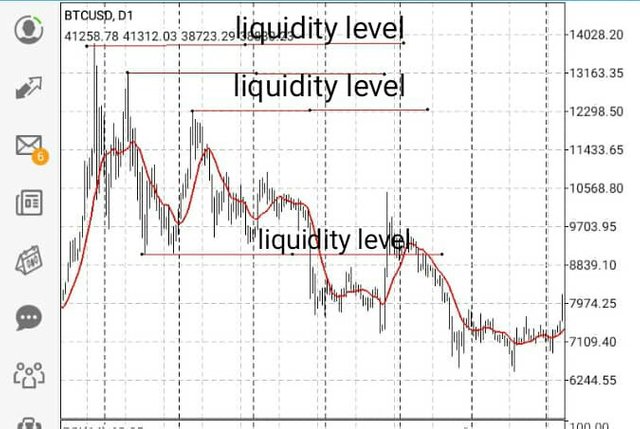
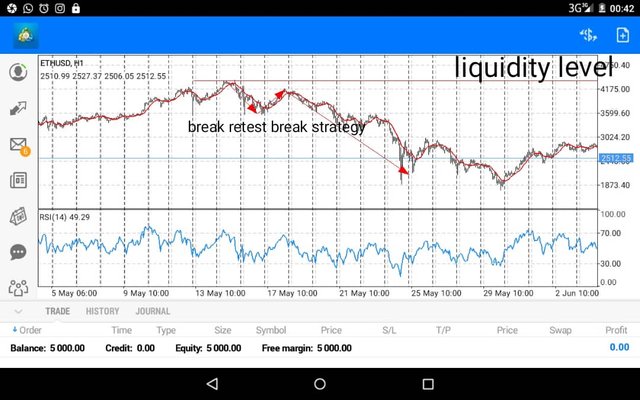
Liquidity level in trading is the level where many order is placed in a crypto market. When buyer and sellers place pending order in the market, the market might be below or higher than their order but once the price gets there it will trigger the market and the order will be placed. It's like setting a point in the market where the price has not gotten there with the hope that the market will eat there. That point is known as the liquidity point.
And also when buyers and sellers set a stop loss so that when the price obey their strategy/plan the stoploss will reduce their loss. This points are referred to as liquidity levels. The most effective sign that is caused by the liquidity point is that there is always a quick reverse in the market trend.
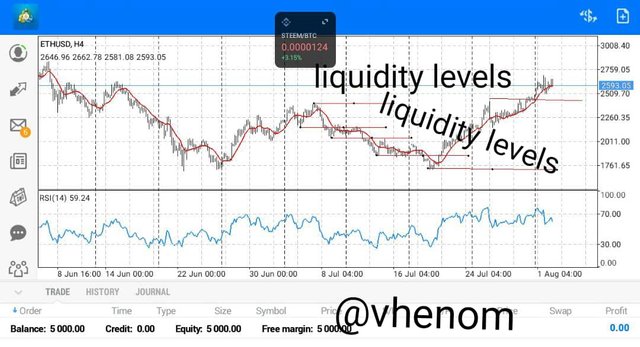
Bellow is a screenshot from my metatrader4 app illustrating the level of liquidity in the BTCUSDT chart and Ethusdt

Explain the reasons why traders got trapped in Fakeouts. Provide at least 2 charts showing clear fakeout.
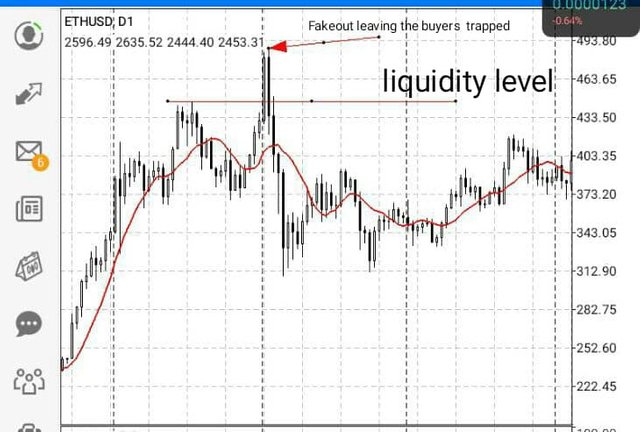
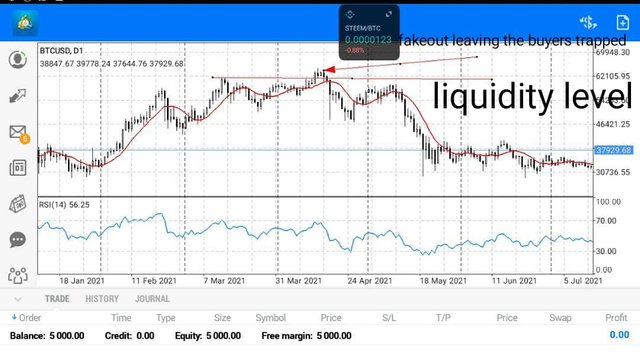
Fakeout is caused by composite man inflating the volume and price of an asset but buying/ selling of larger volume in the market. They make the market go in the way they want not caring about other retailers positions. Fakeout is when the composite man manipulate the market to take out retailers stoploss. They will buy or sell large volume so the price will break the liquidity levels before they later close those positions.
When the composite man take their position the retails will imagine that the price has broke liquidity level they will exit their current positions to follow the current trend. But the composite man will leave the market as soon as they have gotten enough liquidity level then this I'll lead to a significant or quick reverse in the trend. This will cause retails trader to lose more. The initial movement is called the fakeout.
This is how retail trader get trapped. They believe that the price has broken the the liquidity levels and price will continue in that trend but the composite man has gotten enough liquidity levels and left the market and the retail traders will be trapped and will loss more.

How you can trade the Liquidity Levels the right way? Write the trade criteria for Liquidity Levels Trading
Let's me explain how to trade the liquidity levels the right way. Whe will have to use our knowledge from past two courses on break retest break and market structure break. This will give us enough knowledge on how to trade with reverse and breakout in the trend.
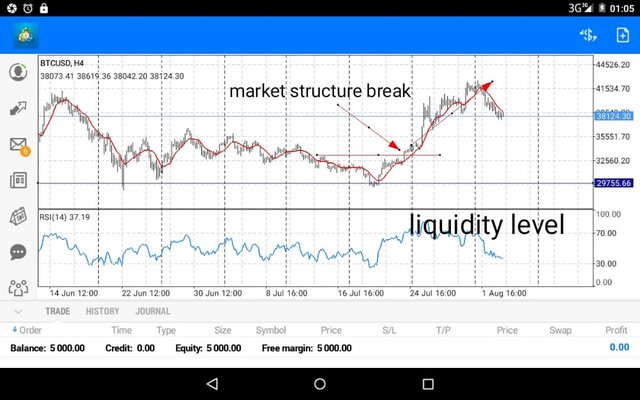
We can only get two probabilities to trade with when the price reaches the liquidity level. Firstly, the price can reverse when it got to this level or the price can breakout this level and continue another trend. That's why we need to use market structure break strategy (MSB) or break retest break(BRB).
Market structure is the movement of market price in a particular trend. The market moves in a way that it create resistance and support in the market trend. The resistance level has a swing point for both low and high points. We then wait for this set up to be complete so we can trade it with the reverse in the market. We can also use this strategy to trade break out also.
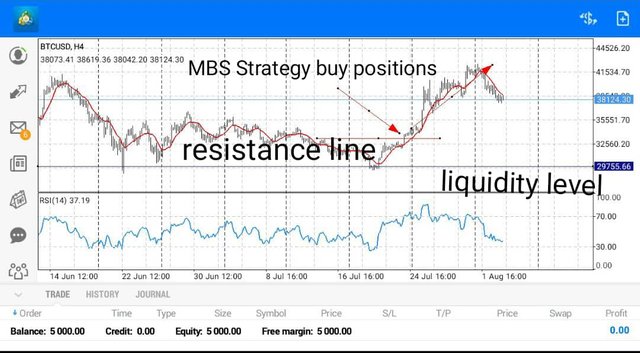
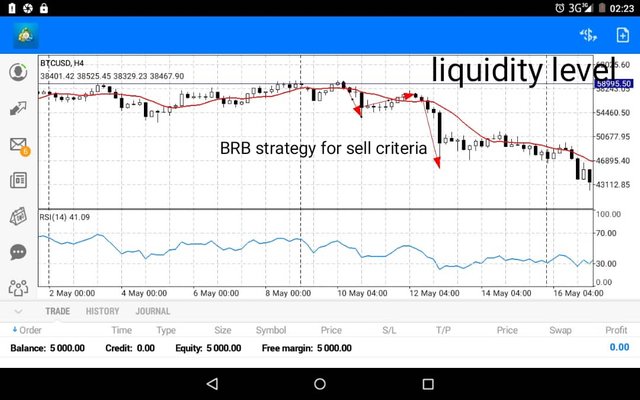
Also Market retest break is when the market price breaks a resistance/ support level then retesting this levels before going higher / or lower to break more levels of either resistance or support depending on the market trend. We can use this strategy to trade continuous trend in the market and like wise no trend will be in a form/ direction forever so at some point we can us ethos strategy to trade reverse in trend.
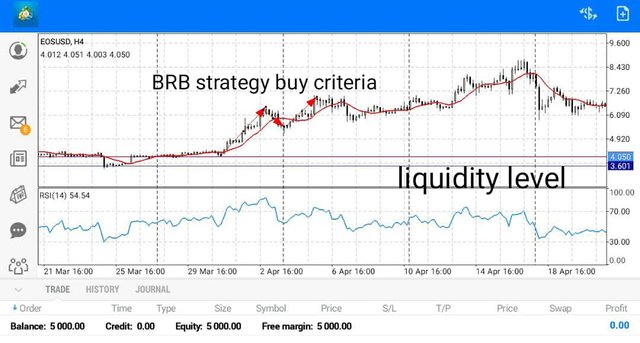
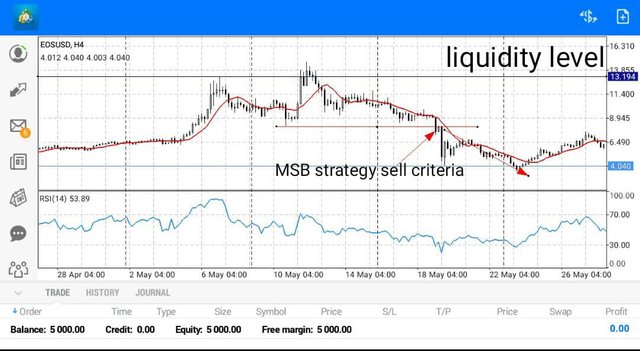
So to trade liquidity levels the right way, after we have gotten our liquidity levels we can checkout for the above strategies to see the one we can use to trade with that liquidity level for a great signal. For a valid set up, we mark our liquidity level in a higher time frame then the go to lower time frame to check for the BRB or MSB strategy to pick our signals.
Below is are screenshots illustrating the above set up from BTCUSDT chart and Ethusdt chart.

Draw Liquidity levels trade setups on 4 Crypto Assets
For this question I will be showing two screenshots each for the four crypto one representing the MSB Strategy and the other representing the BRB Strategy also.
- These are screenshot of BTCUSDT chart showing a setup on how to trade liquidity levels using the MSB and BRB strategies
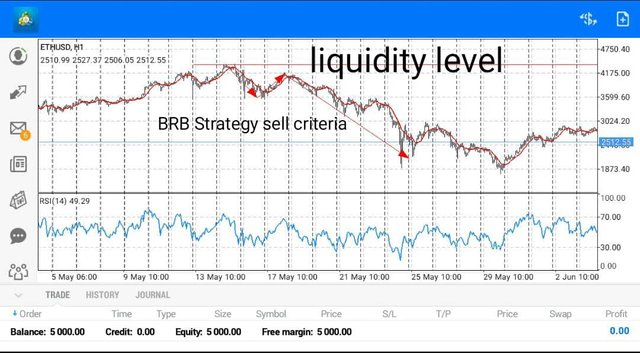
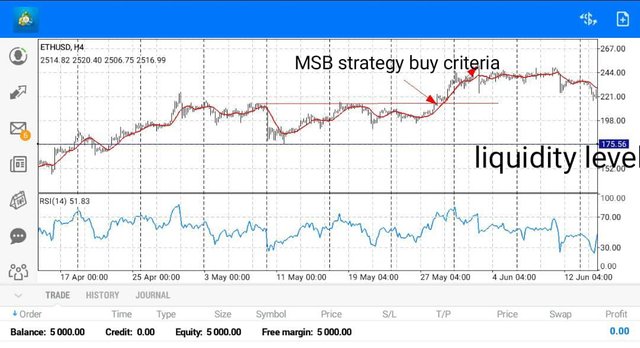
- These are screen shot of Ethusdt chart showing the setup on how to trade liquidity level with MSB and BRB strategies
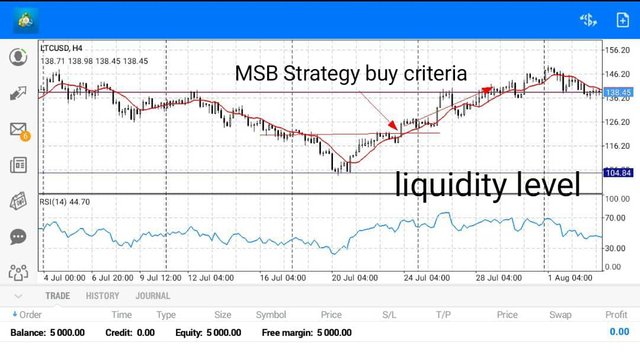
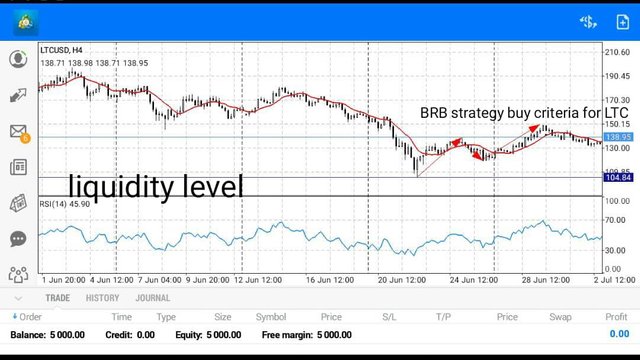
- These are screen shot of Ltcusdt chart showing the setup on how to trade liquidity level with MSB and BRB strategies.
- These are screen shot of EOsusdt chart showing the setup on how to trade liquidity level with MSB and BRB strategies
CONCLUSION
Liquidity level in trading are the points where many order are been placed in a crypto market. When buyer and sellers place pending order in the market, the market might be below or higher than their order but once the price gets there it will trigger the market and the order will be placed. Liquidity level cand be traded based on two strategy break retest break(for continuous trend) and market structure break ( for reversal) after marking our liquidity points we then check for this set up.
Lastly it is advisable for use to set our liquidity level on a higher time frame like weekly, daily then checking for the BRB and MSB setup on lower time zone. And mind you you can use the liquidity levels to trade on any time frame.
CC @cryptokraze
Good work, well resourced! I enjoyed reading. Thanks so much!
Wow am glad you liked my work
Dear @vhenom
Thank you for participating in Steemit Crypto Academy Season 03 and making efforts to complete the homework task. You got 5/10 Grade Points according to the following Scale;
Key Notes:
We appreciate your efforts in Crypto academy and look forward for your next homework tasks.
Regards
@cryptokraze