"[Trading Using Wedge Pattern] - Crypto Academy / S5W5 - Homework Post for @sachin08".

Good day my fellow steemians!!
Its another new week of the steemit cryptoacademy season 5 , we are into the week 5 of it. Professor @sachin08 has made a wonderful presentation about how to trade using wedge pattern. It was well detailed and understandable. Below is my homework task.
To start, we should first of all know what wedge pattern is used for when trading in the market. Well, wedge pattern is said to be one of the technical analysis traders usually carries out in order to predict the future movement in market price. When traders use this, it shows them thr perfect time to enter the market and also the perfect time to exit, as well as entering a long position and a short position when trading on futures trades.
This wedge pattern, can br found at the top of thr chart and also at the buttom of thr chart. Now, the two types of wedge pattern can be considered or be seen at the top or buttom of the chart. Rising wedge pattern is normally seen at the top of the chart, i.e when this shows up, traders are being alerted that the market will bearish or reverse back in the other direction which is the bearish movement. Also falling wedge pattern is normally seen at the buttom of the chart, i.e when this shows up, traders are being alerted that the market will bullish lr reverse back in the other direction which is the bullish movement. This is what traders normally considers in other to make a good trade.
Another thing is that, this wedge pattern uses two trendline, i.e to be able to perform analysis on wedge pattern, there must be two trendline, the both trendline must be going in updward direction when we considering the rising wedge pattern and also the both trendline will be going in downward direction when considering the falling wedge pattern.
Like i discussed in the question abovr, that there are two types of wedge pattern, which are ÷ **The rising wedge pattern and Falling wedge pattern. Below is the explanation of these forms of wedge pattern. Which also will explain how a trader can identify it in the chart.
RISING WEDGE PATTERN
The rising wedge pattern is said to be a bearish signal, because when the rising wedge pattern is created, it signal traders that there will be a trend reversal after this pattern is formed, so now when this is formed or created, this is where traders gets ready to enter a sell order in the market.
IDENTIFYING RSISING WEDGE PATTERN
This is some how simple to understand, when identify the rising wedge pattern, as a trader, this is normally being drawn with two trendlines, also this trendlines should be in an upward motion, now it will perform the role of support and resistance point, whereby the price will be hitting bothe the support and resistance point and bouncing back untill a breakout will occurs, then the market will start bearishing. Lets see the screenshot below.
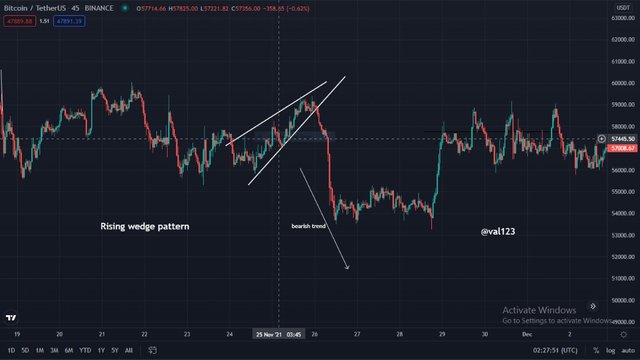
Lets look at the screenshot u provided above, we can see how i drew my trendlines moving upward, whereby the price was hitting thr support and resistance level, untill a reversal occurs and the market started bearishing.
FALLING WEDGE PATTERN
The falling wedge pattern is said to be a bullish signal, because when the falling wedge pattern is created, it signal traders that there will be a trend reversal after this pattern is formed, so now when this is formed or created, this is where traders gets ready to enter a buy order in the market.
IDENTIFYING FALLING WEDGE PATTERN
This is some how simple to understand, when identifying the falling wedge pattern, as a trader, this is normally being drawn with two trendlines too, also this trendlines should be in a downward motion or movement, now it will perform the role of support and resistance point, whereby the price will be hitting both the support and resistance point and bouncing back untill a breakout will occurs, then the market will start bullishing Lets see the screenshot below.
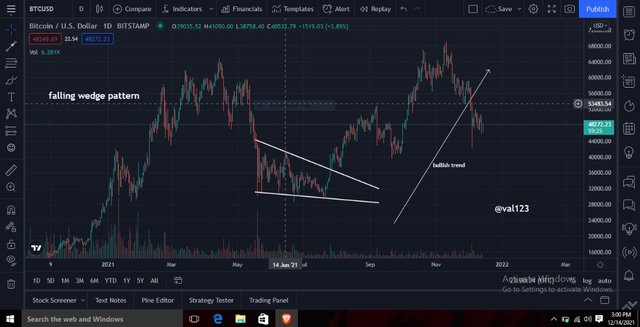
Lets look at the screenshot u provided above, we can see how i drew my trendlines moving downward, whereby the price was hitting the support and resistance level, untill a reversal occurs and the market started bullishing.
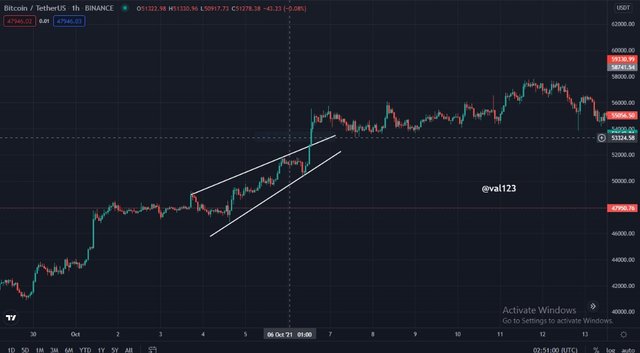
Lets look at the screnshot above. This is a rising wedge pattern, but actually it gave a false signal, why do i said so? Ok, we all learnt that in rising wedge pattern is created or formed, then there will suppose to be a breakout in the support level which will lead to a bearish trend and this also signal traders to take a sell order.
Now, looking at the screenshot above , we can see how the rising pattern was formed, the price was hitting the support and resistance level, then when this is formed, traders are expecting a breakout to occur in the support level so that they can take a sell order or short the market. But eventually, there was a false direction, the price moved up instead of moving downward.
So with this i pointed out above, this is clearly showed to us that sometimes, wedge patterns can also give traders wrong or false signal. This is also how we can filter it out.
TRADE SETUP FOR RISING WEDGE PATTERN
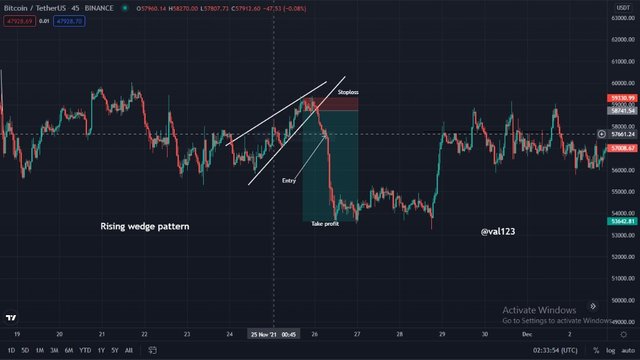
The image above shows thr BTCUSDT chart i provided. This is also rising wedge pattern which am using to perfomr this trade. As we discussed, that when a rising wedge pattern is formed, we have to get ready to enter a sell position.
Looking at the chart i provided, after the wedge pattern us created and there was a breakout at the point of 58741.54, the i waited for the price to trend down more so that i will be sure of the trend. So at 57661.24 i took my entry point there. Then set my stop loss at the top of the chart which is at 59330.99 and then set my take profit at 53642.81, remember, am shorting the market, so when thr price trends down and then goes to the point where i set my take profite, the price will be executed.
TRADE SETUP FOR FALLING WEDGE PATTERN
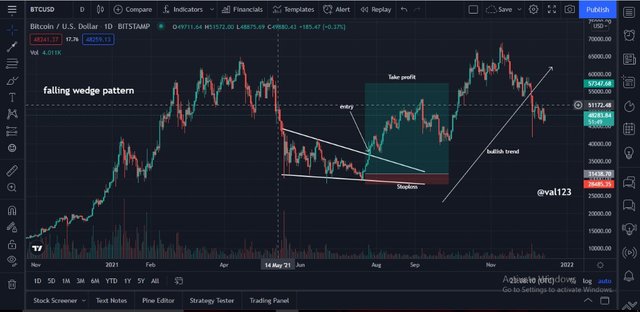
The image above shows the BTCUSDT chart i provided. This is also falling wedge pattern which am using to perform this trade. As we discussed, that when a falling wedge pattern is formed, we have to get ready to enter a buy position.
Looking at the chart i provided, after the falling wedge pattern was created and there was a breakout at the point of 35100.00, then i took my entry 35200.00 Then set my stop loss at the buttom of the chart which is at 28485.35 and then set my take profit at 57347.68, remember, am in a long position, so when thr price trends up and then goes to the point where i set my take profite, the price will be executed.
As a trader, we should know how we can be able to trade with wedge pattern, and also to make a good trading, by knowing the perfect time to exist the market and the perfect time to enter the market in a given period. So, trading with wedge pattern is another thing that can help us in trading cryptos. A big thanks to professor @sachin08 for a wonderful lecture, i learnt a lot from it.
Thanks for reading
Cc-
Professor @sachin08