"[Trading Using Rectangle Pattern] - Crypto Academy / S5W4 - Homework Post for @sachin08".
CANVA
Good day my fellow steemains,
Its another new week of the steemit cryptoacademy season 5. I have read and understand the lecture professor @sachin08 provided which was about Trading Using Rectangle Pattern. It was well detailed and i learnt a lot from it.
The rectangle pattern is formed above or below the price chart, which be drawn making use of 2 trendline by drawing it horizontally up and down the chart which serves or perform the role of support and resistance point. The rectangle pattern are technical analysis carried out by traders in ordeer to know or predict the future movement of the market.
This rectangle pattern is being drawn whenever the price is making an equal movement in the price chart i.e when bulls and bears are equally controlling the price without making any trend like uptrend or downtrend. The rectangle pattern can be seen above the market chart or below the market chart. When its seen at the top of the chart, traders are alerted that the market might bearish when a breakout occurs in the support line, this shows the weakness of buyers not able to control the market. Similarly, when it's seen at the buttom of the chart, traders are alerted that the market might bullish when a breakout occurs in the resistance point, this shows the weakness of sellers not able to control the market
This also means that whenever the market forms a ranging market i.e where we can draw our trendline creating a rectangle pattern, if its seen at the top of the chart and then hit and crosses the support line, we should get ready to short the market. Also, whenever the market forms a ranging market i.e where we can draw our trendline creating the rectangle pattern, if it's seen below the chart and then hits and crosses the resistance level, we shoulf get ready to enter a long position.
There are ways one can identify the rectangle pattern which i will explain below and also provide screenshot.
Rectangle pattern, are seen at the top of the price chart or the buttom of the price chart. To know rectangle pattern, you will see a particular price going up and down without crossing the each other i.e it keeps going zigzag without making a massive bullish trend or massive bearish trend, this is more like a ranging market. When you see rectangle pattern in the market chart, the trending is 5050, bulls and bears are equally moving the market. At this time, we have to draw out two horizontal trendline, whereby one we be placed at the top of the ranging movement and the other will be placed under or below the ranging movement.
So when a chart is trending like that, not making any higher lows or higher highs and vice-versa, we tend to draw out trendline forming a rectangle pattern. We should keep in mind that this rectangle pattern are best in trading breakout because after this ranging movement, their must be a breakout among the two (bullish and bearish). Lets see screenshot below.
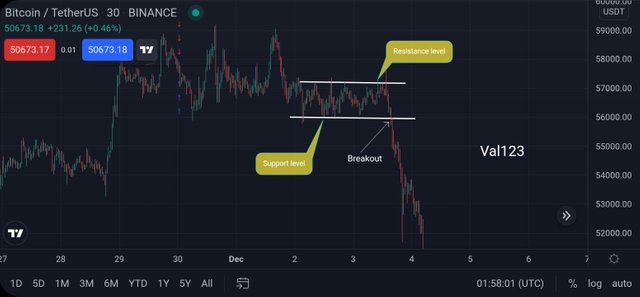
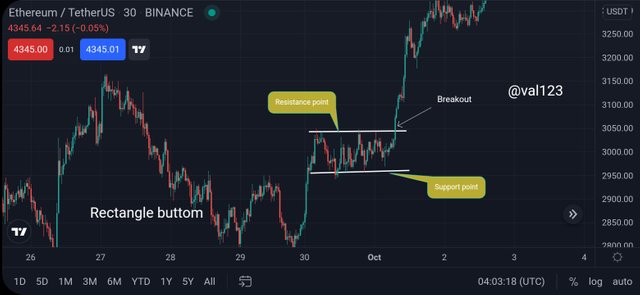
Looking at the chart above, there we can see an example of rectangle pattern. The price was moving zigzag i.e ranging movement, whereby both buyers and seller cannot be able to know who to control the market. As we can view the chart, the market price was just trending up and down and was touching the support and resistance without moving upward or downward. Then later, a breakout occurs at the suppot point, then crosses it and trends down.
We can get accurate result in predicting market price if we combine indicators to the analysis we made. After performing my analysis, i added half trend indicator so that i can know or get a more better result on how the market will trend.
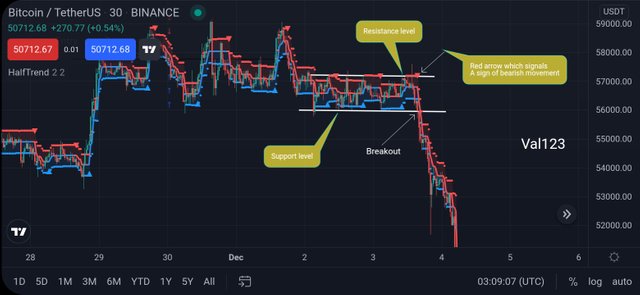
The chart above, are technical analysis of rectangle pattern and also combining the half trend indicator with, in other to get a better result on the market movement. Now at the chart, when a rectangle patter wad form, the price keep hitting the support and the resistance point with trending up or trending down, so finally a breakout occurs, so now because am making use of the half trend indicators, i was shown a signal, a red arrow appears at the top of the chart after thr brekout, this shows that the market is about to move to the negative side which bearish movemnt.
Rectangle pattern can be seen in tow places on the chart, it can be seen at the top of the chart and it can also be seen at the bittom of the chart. That is why we have Rectangle Top and Rectangle Buttom which i will be explaining below.
THE RECTANGLE TOPS
The rectangle tops are usually seen at the top of the chart, whereby the price moves up and down equally without trending up or trending down, forming a ranging market and the shows the struggle among bulls and bears on who will take over the market price. When this type of trend is in motion, we should understand that the market are controlled equally.
But normally in rectangle top, when this type of trend occurs we usually expect the market to go down breaking out the support line and after the breakout, a bearish movement will occur and we can say that bear are now in full control of the market and this is usually a selling position traders have to take. Seee screenshot below.
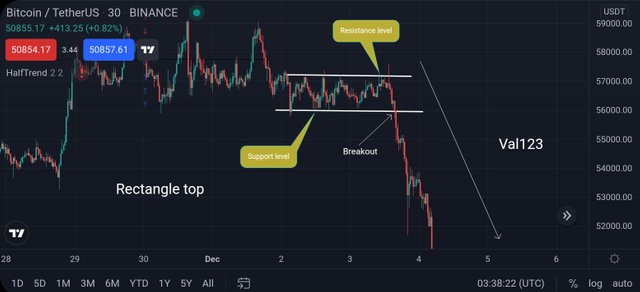
Let me explain the screenshot above, this chart shows a rectangle top. The market was moving up and down between the support and resistance point. Like i stated that in rectangle top, when this trend occurs, we shoulfmd be expecting the breakout to happen at the support level and after that there will be a bearish movement. So the chart above illustrates the rectangle top.
THE RECTANGLE BUTTOM
The rectangle buttom are usually seen under or below the chart, whereby the price moves up and down equally without trending up or trending down, forming a ranging market and the shows the struggle among bulls and bears on who will take over the market price. When this type of trend is in motion, we should understand that the market are controlled equally.
But normally in rectangle buttom, when this type of trend occurs we usually expect the market to go up or trend up breaking out the resistance line and after the breakout, a bullish movement will occur and we can say that bulls are now in full control of the market and this is usually a buying position traders have to take. Seee screenshot below.
Let me explain the screenshot above, this chart shows a rectangle buttom. The market was moving up and down between the support and resistance point. Like i stated that in rectangle buttom, when this trend occurs, we should be expecting the breakout to happen at the resistance level and after that there will be a bullish movement. So the chart above illustrates the rectangle buttom
RECTANGLE TOP [BTCUSDT CHART]
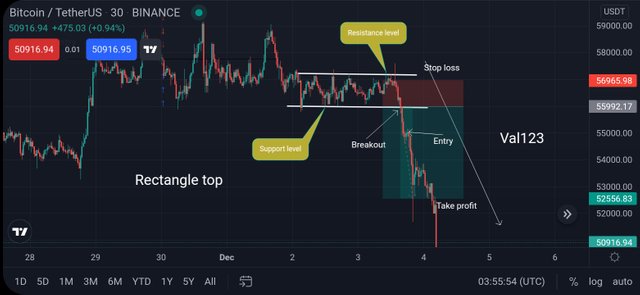
Looking at the chart above is a trade set up i made using the rectangle top pattern, as we can see at the chart, when i drew two horizontal trendline, forming rectangle pattern and its located at the top of the chart, now this pattern is best for trading breakout, when the market is moving up and down between the support and resistance point, there was a breakout at 55992.17 , the market starts bearishing, then i have to take my entry at 55000.00 after that i set up my stop loss at 56965.98 which is set at the top and then below, i set my take profit at 52556.83. This particular set up is called shorting position, because i notice that the market is bearishing, so i entered a sell position and short the market. Once the price hits my target, it will execute.
RECTANGLE BUTTOM [ETHUSDT CHART]
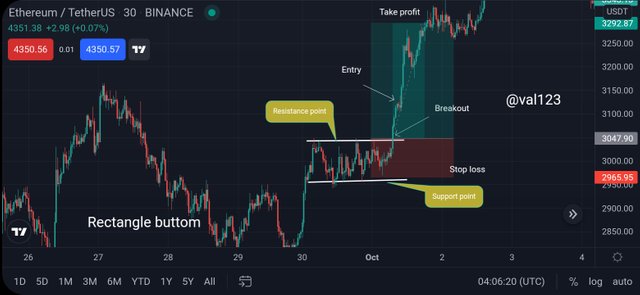
Looking at the chart above is a trade set up i made using the rectangle buttom pattern, as we can see at the chart, when i drew two horizontal trendline, forming rectangle pattern and its located at the downside or below the chart, now this pattern is best for trading breakout, when the market is moving up and down between the support and resistance point, there was a breakout at 3047.90 , the market starts bullishing, then i have to take my entry at 3120.00 after that i set up my stop loss at 2965.95 which is set below the chart and then above the chart, i set my take profit at 3292.87. This particular set up is called long position, because i notice that the market is bullishing, so i entered a buy position and long the market. Once the price hits my target, it will execute.
IN CONCLUSION
Rectangle pattern is one of the best technical analysis trader use in predicting market future, knowing the next trend that will occur in the market price. Thanks to professor @sachin08 for a nice lecture, i gained a lot from it.
Cc÷
Professor @sachin08