Steemit Crypto Academy Season 5 Week 1 [Beginner's Course] - Understanding Trends: by @val123


You all are welcome to another new season of the steemit cryptoacademy "The season 5 week 1". Professor @reminiscence01 has made a wonderful lecture about " Understanding trend" which i was able to learn from it. Below is my homework post.
In trending market, we all know that it normally provides full data or information to traders, showing them the current trend in the market. When market is trending, it could go upwards or downwards in a given period of time. When the market price is trending upwards, its said to be that buyers are controlling the market, meanwhile, when the market price us trending downwards, its said to be that sellers are in control of the market. Below is an exmaple of a trending market chart. Using ADAUSDT.
Well, personally speaking and from the research i made, when we talk about trending market, its just the movement of market price going to a specific way or path. Trending market can only trend in a bullish or bearish movement in a given period of time, which trends or can peform higher high and higher lows then performs lower highs snd lower low( for bullish and bearish trend).
When the market is trending upwards, which can simply be called bullish trend, this signifies the positive movement in the market pruce. This is similar to downtrend, which simply can be called bearish trends, this signifies the negative motion of the market price.
We should also note that, whenever the market start bullishing, it shows that the buyer are in charge of tge market, but whenever the market price start bearishing, it shows that sellers are in charge of the market. Making us of technical analysis, a trader can know when a particular trend is about to take place in the market.
Mostly we usually hear about bulls and bears in finicial market, what does that mean? Below is the definition of bullish and bearish trend.
BULLISH TREND
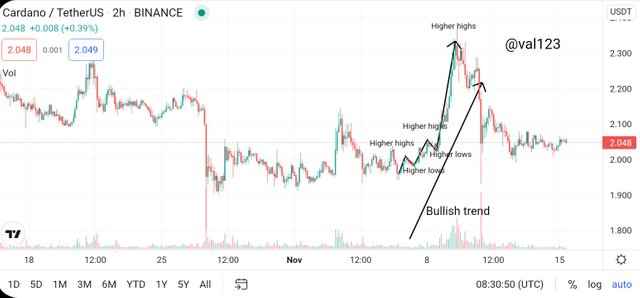
Bulls signifies positive. When the market is bullishng it show that the market price is in a positive motion. In a simple explanation, bullish trend shows the positive movement in market price which usually forms the higher highs and higher lows. Bullish trend often occurs when buyers are purchasing a particular asset, which shows that buyers are in full control of the market price. When the market starts bullishing the candlestick usually turn green colour. Below is a screenshot of a bullish trend chart.

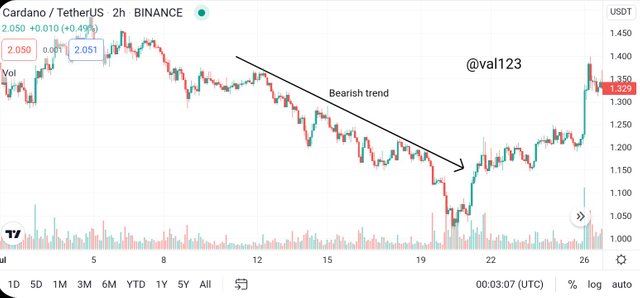
BEARISH TREND
Bears signifies negative. When the market is bearishing, it shows that the market price is a positive motion. In a simplesimple explanation, bearish trend shows the negative movement in the market price which usually forms the lower highs and lower lows. Bearish trend often occurs when sellers are purchasing a particular asset, which shows that sellers are in full control of the market price. When the market starts bearish the candlestick usually turn red colour. Below is a screenshot of a bearish trend chart.
2) Explain the following trend identification and give an example of each of them. (Original screenshot needed from your chart). Do this for a bullish and a bearish trend.
i) Market Structure.
ii) Trendlines
There arr things we consider when analyzing a particular asset using the chart. These things we consider can be,what time should we buy? What time should we sell or do we just leave the market. These things are what most traders consider while looking at the chart. Well, market structure is the best strategy to use in knowing the perfect time to buy or the perfect time to sell a particular asset in a given period of time. Market structure helps traders to do analysis, knowing or specifying the recent trend on the market price and helping them to know the decision or step to take. Now lets see market structure for bullish and bearish trend
MARKET STRUCTURE FOR BULLISH TREND
Market structure considering bullish trend is the best and perfect time to buy and it usually makes movement of going higher highs and higher lows. Let me explain
In these type of trend in market structure, when the price moves up, then trying to go a little bit down, then it bounces up again, at this time it goes higher more than the previous high, and then comes down again but will not exceed the limit of the previous high lows, then bounces up again, going more higher i.e creating a new higher highs. This particular move keeps moving continuously.
MARKET STRUCTURE FOR BEARISH TREND
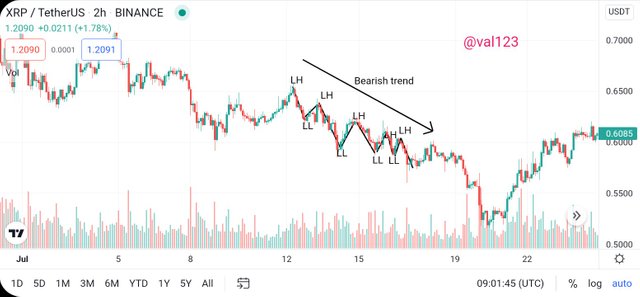
Market structure considering bearish trend is the best and perfect time to sell and it usually makes movement of going lower highs and lower lows. Let me explain
In these type of trend in market structure, when the price trend down, then trying to go a little bit up, then it bounces back, at this time it goes lower more than the previous low, and them comes up again but will not exceed the limit of the previous lower high, then bounces back again, going more lower i.e creating a new lower low. This particular move keeps moving continuously.
Trendlines is technical equipment or tool that traders mostly use in analyzing how the market moves in a given time frame, which can be easy be drawn in two low point for uptrend motion and also two high point for downtrend motion. Now lets look at bullish and bearish trend for Trendlines.
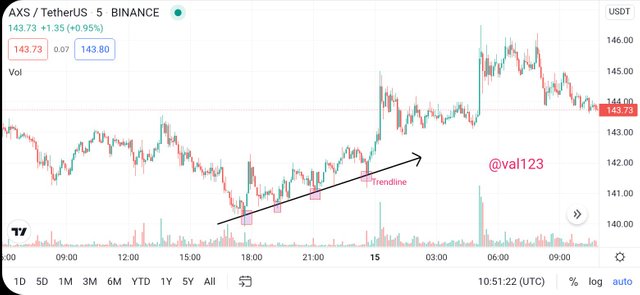
TRENDLINE FOR BULLISH TREND
The trendline is located at the buttom of the market chart perfoming the role of support level in the chart. Anytime the market price hit the point of the trendline i drew in the chart below, it bounce up, it keeps doing that repeatedly. The period of this trend is when traders normally purchase on a particular asset. Below is the screenshot i provided.
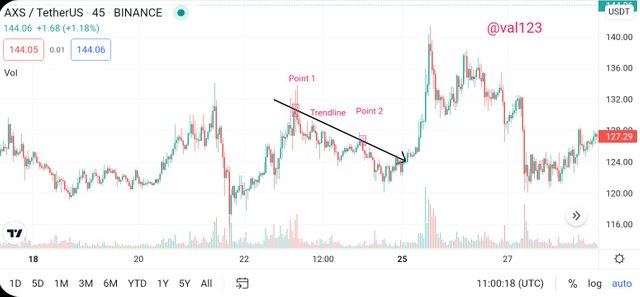
TRENDLINE FOR BEARISH TREND
The trendline is located at the top of the market chart, perfoming the role of resistance level in chart. Anytime the market price hits the point of the trendline i drew in the chart below, it bounce lower keeps doing that repeatedly. The period of this trend is when traders normally sell there asset. Below is the screenshot i provided.
3) Explain trend continuation and how to spot them using market structure and trendlines. (Screenshot needed). Do this for both bullish and bearish trends.
Trend continuation us something that form a patten in the market. pushing up will form a pattern to suggest that there will he a continuation in price and continue moving up or vise versa. When moving down, you will see where these patterns might suggest that it will continue moving lower.
In a simple explanation, trend continuation is the continuation of market price patterns which repeats it's former trend pattern, then continues trending repeatedly.
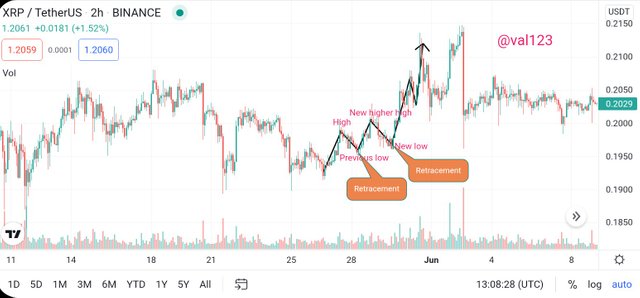
IN BULLISH TREND
Normally, when this occurs, it notifies traders that buyers have taking over the market or controlling the market.
Professor @reminiscence01 let us know that in bearish trend continuation, traders usually consider during tracement in market structure.
The new low created should not move lower more than the previous low level. Then the new high that was formulated should trend higher than the previous high
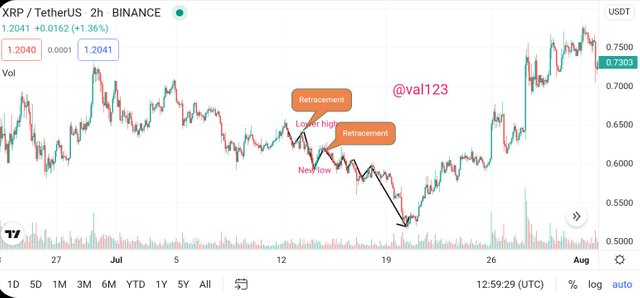
IN BEARISH TREND
Normally, when this type of trend occurs, it notifies traders that sellers have taking over the market or controlling the market. There are things traders mostly consider during retracement in this type of bearish trend.
The new high created should not move higher than the previous high level. The new low that was formulated should move lower than the previous low.
BULLISH TREND
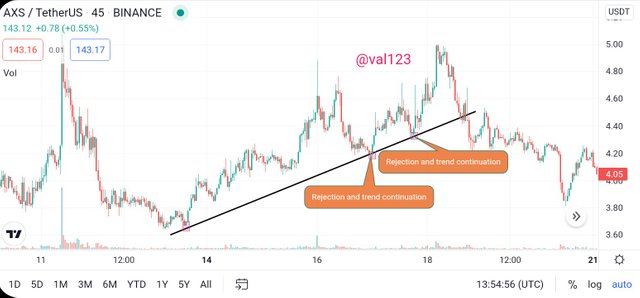
Trendlines is technical equipment or tool that traders mostly use in analyzing how the market moves in a given time frame. Now look at the chart below, trendline perform the role as a support level when it comes to bullish trend. Now as we can see at the chart, anytime market reaches the trendline, it hit it and goes more higher than before. see screenshot below
IN BEARISH TREND
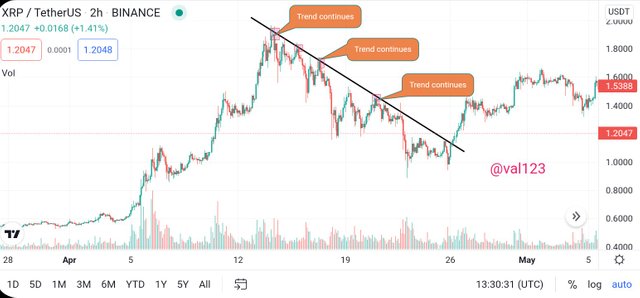
Looking at the chart below, trendline perform the role as a resistance level when it comes to bullish trend. Now as we can see at the chart, anytime market reaches the trendline, it hits it and pull down. It goes down more than before. see screenshot below
4) Pick up any crypto-asset chart and answer the following questions -
i) Is the market trending?
ii) What is the current market trend? (Use the chart to back up your answers)
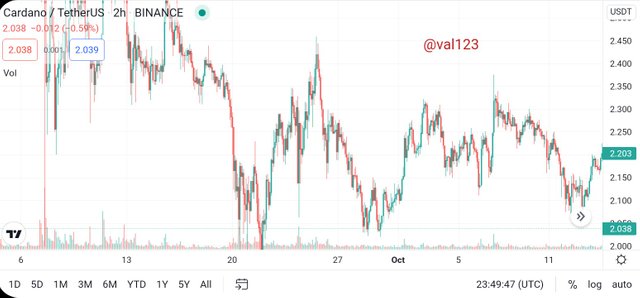
The chart below forms are ranging market. As we can see the market i just bouncing up and down between the support and resistance level and does not have any particular trend. Trader usually enter the market at the support level and take out their profit at the resistance level. The is just the effort of buyers and sellers tugging who will control the market.
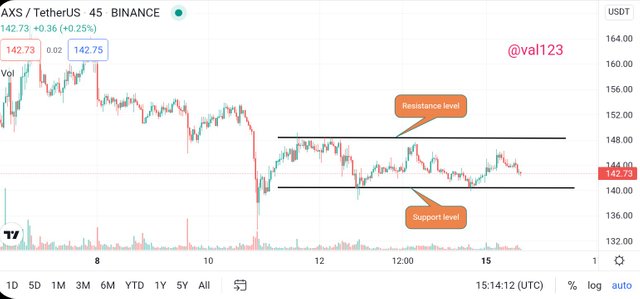
Currently, this particular asset, does not have any trend, it just moving sideways, from the support level to the resistance level. As we can see on the chart above, the first hitting point on the support level did not go higher that the previous high, then the second hitting point on thr support level did not go higher than the first point did. From my observation, buyers are not too strong the breakout the trend, and this might lead in sellers taking over the market if the price breakout at the support level and pass it. It will cause the matket to bearish.
CONCLUSION
Trends is what traders have to master and be good in using it because, it help in analyzing the movement of the market and the next trend that will occur. Much appreciation to professor @reminiscence01 for the wonderful lecture i really learnt a lot.
THANKS FOR STOPING
CC-
Professor @reminiscence01
Hello @val123, I’m glad you participated in the 1st week Season 5 of the Beginner’s class at the Steemit Crypto Academy. Your grades in this task are as follows:
Recommendation / Feedback:
Thank you for submitting your homework task.