[ Effective Trading Strategy using Line Charts ]-Steemit Crypto Academy | S6W1 | Homework Post for @dilchamo


Hello steemians, you all are welcome to the new season of the steemit cryptoacademy season 6 week 1. Is a great privilege to be part of the wonderful lecture which was specified by professor @dilchamo. The lecture was all about Effective Trading Strategy Using Line Charts. Below is my entry for this lecture.. Lets go!
Q1. DEFINE LINE CHARTS IN YOUR OWN WORDS AND IDENTIFY THE USES OF LINE CHARTS.
Line chart is seen as one of the simple technical chart for beginners in the crypto world to make use of. Line chart are very simple or easy to understand. People who are new in the crypto world is adviced to make use of line chart due to its simplicity i.e one can easily read and understand the market movement.
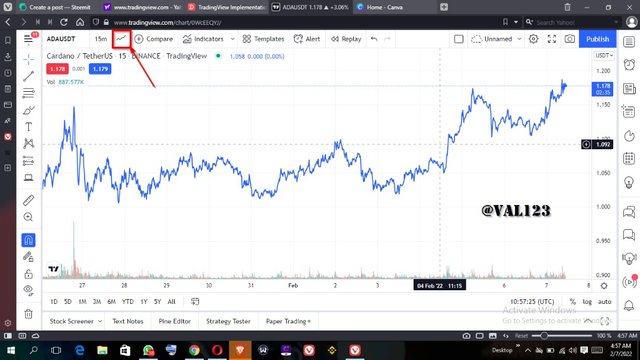
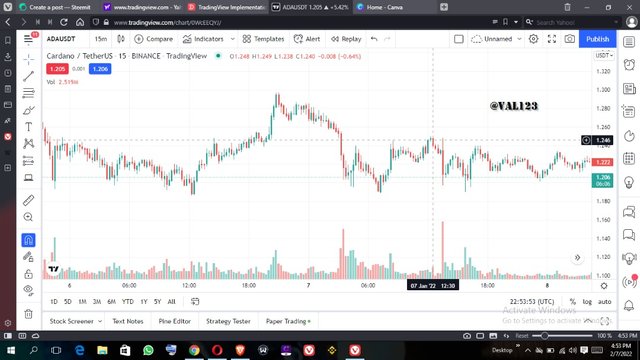
Line chart are also easy to identify the support and resistance levels, which is the major key while trading on crypto assets. I can say that not only beginners uses line chart, but most traders make use of it in crypto trading. The screenshot below is an example of a line chart in tradingview. To find the line chart, click on the line icon at the top of the page. See screenshot below.
Though many traders love using Japanese cadlestick or Bars. The line chart contains the closing price in a given period of time. This makes it the simplest chart pattern to use while trading especially for beginners.
Just like in japanese candlestick chart we have the open, the close, the high, the low. So for line charts, is been used to identify or deals with the closing price.
The line chart also point up the keys level or key point in the market chart . Furthermore, using line chart can be easy for a trader to draw his or her support and resistance line and also trendline as well.
Drawing the ascending triangle and descending triangle using line chart can be very easy to draw, this is why is very important for beginners to make use of line charts.
When using line chart, it will be clear to you on how the market moves and this can make a trader to easily make profit when trading.
Q2. HOW TO IDENTIFY SUPPORT AND RESISTANCE LEVELS USING LINE CHARTS (DEMONSTRATE WITH SCREENSHOTS)
Trading with support and resistance level is very essential. Traders mostly use the support and resistance level to trigger the market breakout, either up or down. Now, i will explain how to identify the support and resistance level using line chart using screenshots.
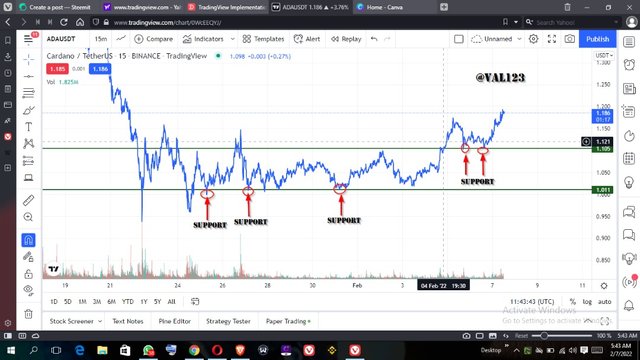
As we all know that support level signals when the market trend is unable to push more lower, it bounces up whenever it hits the support line that its been drawn. Though sometimes, the support level can be broken and then can also serve as resistance level when the market goes more bearish. Once there is a breakout in the support level, this signals that sellers are strong enough to control the market. This is when traders normall enter a short position in the market. Below is an example of support level using line chart.
As we can see at the screenshot i provided above, this is ADAUSDT chart. The chart shows a support level. We can see how the trend moves, hitting the support line which i draw, then bouncing up.
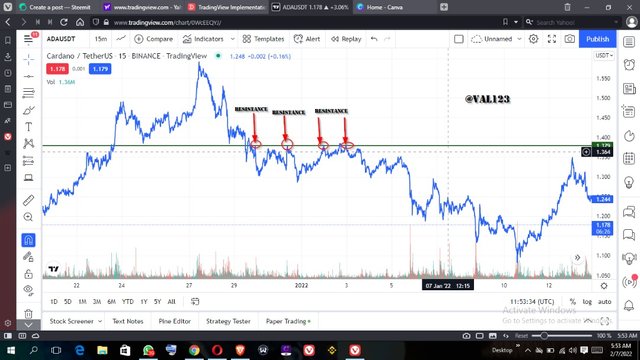
As we all know that resistance level signals when the market trend is unable to push more higher, it pulls back whenever it hits the resistance line that its been drawn. Though sometimes, the resistance level can be broken and then can also serve as support level when the market goes more bullish. Once there is a breakout in the resistance level, this signals that buyers are strong enough to control the market. This is when traders normally enter a long position in the market. Below is an example of resistance level using line chart.
As we can see at the screenshot i provided above, this is ADAUSDT chart. The chart shows a resistance level. We can see how the trend moves, hitting the resistance line which i draw, then pulling back.
Q3. DIFFERENTIATE BETWEEN LINE CHARTS AND CANDLESTICK CHARTS.( DEMONSTRATE WITH SCREENSHOTS)
| LINE CHARTS | CANDLESTICK CHARTS |
|---|---|
| Line chart is very simple to read or identify market trend and this is mostly used by beginners | the candlestick chart contain more colours, and this is mostly used by expert traders. |
| Line chart eliminate many data points on the chart and also it deals with the closing price | A candlestick pattern consist of the open, the high, the low and finally the close. |
| Easy for traders to understand | candlestick chart conatin more data or information in a given period of time and this can be very difficult for beginners to understand. |
Below is the example of line chart and candlestick chart
Q4. EXPLAIN THE OTHER SUITABLE INDICATORS THAT CAN BE USED WITH LINE CHARTS.(DEMONSTRATE WITH SCREENSHOTS)
Well, its advisable for a trader to trade with confluence. That is using different strategies while trading. For me, i can say that half trend indicator is suitable for line chart. I love making use of half trend indicator, due to its easy to identify trend movement in a given period of time. The half trend indicators signals bullish and bearish trend. Whenever a red arrow appears at the top of the chart, this shows that the market is about to go bearish and whenever a blue arrow appears below the chart, its signal a bullish trend.
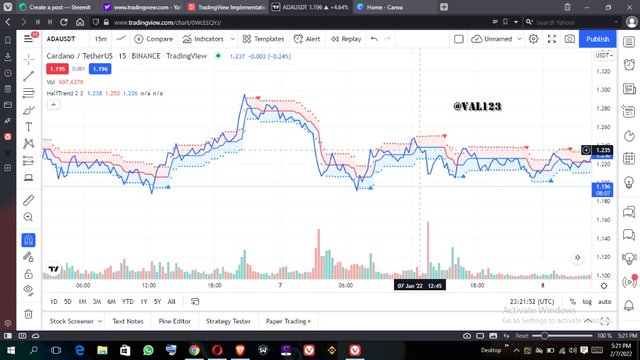
So we can see the chart above, i added the half trend indicator along with the line chart. We can see that any point the red arrow appears the market goes down and any point the blue arrow appears the market goes up.
I can say that using the half trend indicator along with the line chart, will be easy to understand and a trader can know the best time to enter a trade. There are also, other indicators one can use along with the line chart eg the moving average. It also gives a better signal to the market price.
Q5. PROVE YOUR UNDERSTANDING OF BULLISH AND BEARISH TRADING OPPORTUNITIES USING LINE CHARTS. (DEMONSTRATE WITH SCREENSHOTS)
There are different ways we can spot the bullish trend or the bearish trend. This can be done by using technical analysis on the market price. This helps in predicting the market next trend and knowing when to buy or when to sell.
A trader can be able to identify the bullish signal just by making use of trendline, when the pirice hits the trendline below which serves as a support level and bouces up, creating a higher high and higher lows. This signal that buyers are controlling the market, so as a trader, you have to take a long position. Lets see screenshot below.
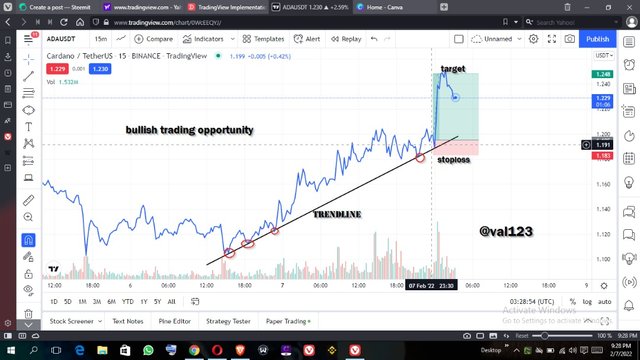
From the screenshot above, you can see how i drew my trendline below the chart which performs the role of a support level. Now the price hits the trendline and bounces up. It keeps doing that continuously, which shows that buyers are in control of the market price. Now once it hit the trendline and bounce up again, i took my entry and entered a long position.
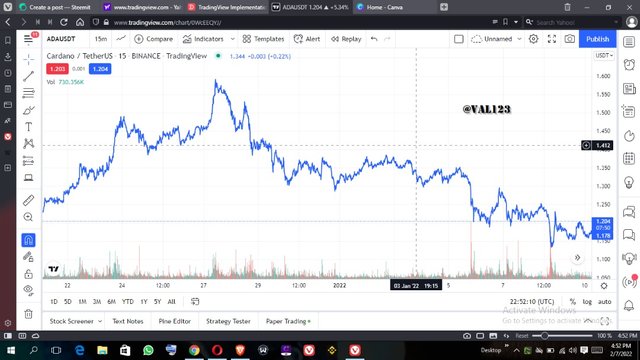
A trader can be able to identify the bearish signal just by making use of descending triangle. Descending triangle, gives traders a downtrend movement in the market chart. This consist of two trendline, which is the horizontal trendline that is drawn below the chart and the other trendline usually moves downward and its located at the top of the chart serving as resistance point. Now once this analysis has been made and there was a breakout at the support point, traders usually enters a short position. Lets see screenshot below.
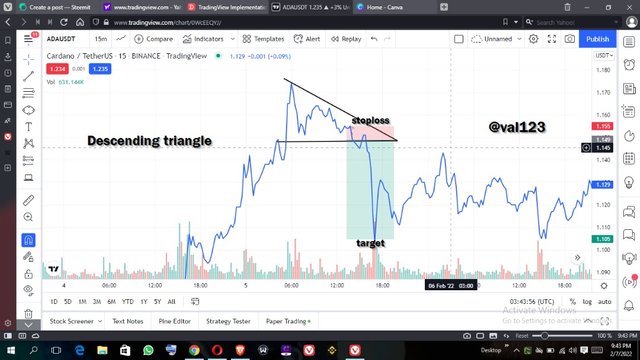
From the screenshot above, you can see the descending triangle looks like. The market was going up and down between the descending triangle till there was a breakout at the downside which is the support level then the market starts bearishing. That was when i took a short position.
Q6. INVESTIGATE THE ADVANTAGES AND DISADVANTAGES OF LINE CHARTS ACCORDING TO YOUR KNOWLEDGE.
Advantages of line chart
- Line chart can be very easy to understand, and its meant especially for beginners.
- The line chart only consist of the closing price and this eliminate noise from while trading.
- while using line chart, its very easy to spot the bullish and bearish movement when making use of technical analysis like the one i used in the above question.
- Also, it is very easy for a trader to identify or spot the support and resistance point which is very essential when trading.
Disadvantages of line chart
- Trading with line chart may not give you all information needed. Since it only deals with closing price while Japanese candlesticks shows the open high and low price in a given period of time. This means that line chart disregard the lows, the high etc.
- using line charts to time your entry point when making use of buy stop or sell stop order, you will enter the trade ahead of time before a breakout will take place. This means that using line chart is not advisable for entry triggers.
CONCLUSION
Trading with line chart is very good due to its simplicity, most especially for beginners and it is very easy to understand. On the other hand, using line can be easy to identify the keys levels, which is the support and resistance level. All thanks to professor @dilchamo for a wonderful lecture, i benefitted from it.
CC- @dilchamo