[Crypto Trading with Moving Average]- Steemit Crypto Academy | S6W2 | Homework Post for @shemul21

Hey guys! I welcome you all to another new week of the steemit cryptoacademy season 6. We are in week 2 already. The lecture about how we can trade with moving average was well detailed and i benefitted a lot from it. Below is my homework post.
Q1. EXPLAIN YOUR UNDERSTANDING OF MOVING AVERAGE.
Moving average is one of the most important indicator used when trading on assets. Many tradeers in the world makes use of it. In many exchange moving average is usually a default indicator. Moving average helps traders to be able to predict the future movement of the market in a given period of time.
Moving average mostly gives an accurate signals to traders and that is why most traders makes use of it when trading. It helps traders to know the perfect time enter the market and the perfect time to exit the market. Moving average calculates the movement of a particular trend based on the price data.
Using moving average indicator, it is always easy for a trader to read the chart and also follow the trend, knowing when to enter buy or sell order in a given period of time.
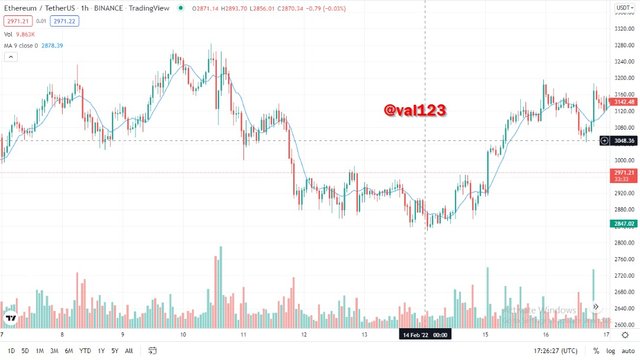
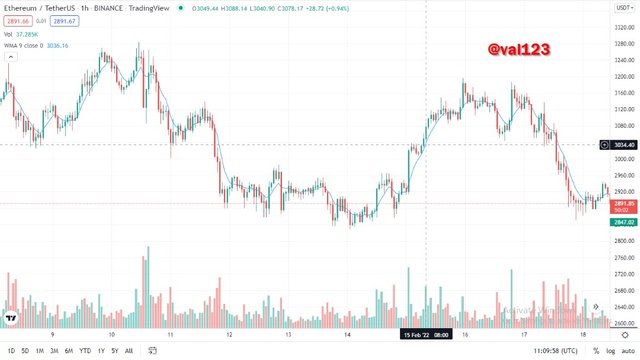
Below is an example of a moving average indicator. Lets see the screenshot below.
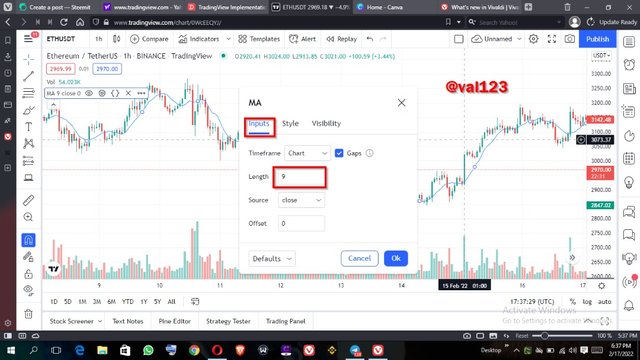
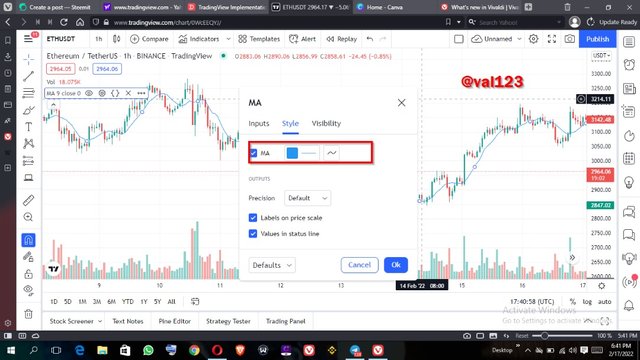
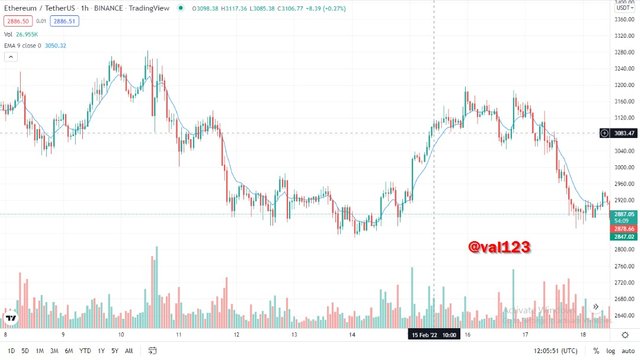
We can also choose how we want the moving average to be, be going to the settings. You can change the length, you can also change the colour of the MA so that you can be able to identify it quickly. Lets see screenshot below.
Q2. WHAT ARE THE DIFFERENT TYPES OF MOVING AVERAGE? DIFFERENTIATE BETWEEN THEM.
We have three different types of Moving average which i will list and explain below.
SIMPLE MOVING AVERAGE INDICATOR (SMA)
WEIGHTED MOVING AVERAGE INDICATOR (WMA)
EXPONENTIAL MOVING AVERAGE INDICATOR (EMA)
Now, i will explain these type of moving average one after another .
- Simple Moving Average (SMA)
Simple moving average is one of the most technical indicator used by traders. It is one of the favorites for investors due to it simple signal it provides. This means that it is very easy to understand and also the calculations on it are very easy to understand.
Simple moving average is calculated through expanding the price in a given timefarme. Though the SMA do not give an accurate prediction on the future movement of the market, we all know that no indicator is 100% accurate. The simple moving average reacts to current markets, so they take a little time to react and shorter term moving average are more sensitive because you are calculating more recent data. So, when the SMA is more short, the signal will be more sensitive.
The formula for this indicator is taking the previous closes of a given period and then dividing it by any number of period. For example
I have a four day moving average, and the close price is ÷
$22+$24+$26+$23=$95/4=$23.75
So i added all these numbers, which gave me $95 and i divided it by 4 which is the number of days, and that gave me and average of 23.75.
($22)+$24+$26+$23+$25=$98/4=$24.5
Now the next day and the closing price is $25. So now, i take those next four days and drop out the previous day. Then divide the numbers by four you will see that our average has increased and this is because the closing price is $2 than the previous one.
($22)+($24)+$26+$23+$25+$29=$149/4=$37.25
Another closing price was added and then i dropped the last two, which is in bracket. Then we do the same thing.
- Weighted Moving Average (WMA)
Weighted moving average is also similar to simple moving average. When using a weighted moving average, the most recent information always gets the highest weight.
This moving average is mostly assigned when there is a need to place more essential on some periods over others. The weighted moving average allows traders to identify the movement of a trend in a given period of time. It aids in spotting movement of the market through proceeding latest information into reflection.
This can be added on tradingview also. click on indicators and search on WMA. Lets see on thr chart below, how it looks like.
You can also customize it from the setting.. Maybe changing to the 50 period WMA.. Weighted moving average is good in finding trend changes. It moves quicker than the other moving average.
Let's the formula for WMA
Weighted moving average = P1 x n + P2 x (n-1)+Pn)/n x (n + 1)/2 = n = Time period
- Exponential Moving Average (EMA)
EMA is also similar to simple moving average indicator. EMA also help traders to identify trend movement in a given period of time. EMA is very simple to understand e.g when it is rising, it signals a bullish trend and when its falling, it signals a bearish trend. This means that, with EMA, traders can be able to know when to enter a buy order or sell order. It is a commonly used indicator. The chart below is how EMA indicator looks like.
The exponential moving average is more sensitive to the front-end prices in its average.
The formula for exponential moving average is
2 divided by the time period plus 1 and it will give the percentage we are going to factor in.
Q3. IDENTIFY ENTRY AND EXIT POINTS USING MOVING AVERAGE. (DEMONSTRATE WITH SCREENSHOTS)
Since we have discussed the types of moving average and know there uses. So in this section, am going to identify or spot entry points and exit point making use of moving average indictors. I will be using two different types of moving average in one chart which are EMA and SMA. lets go!
Am using 50 period for the exponential moving average then 20 period for the simple moving average, ETHUSDT.
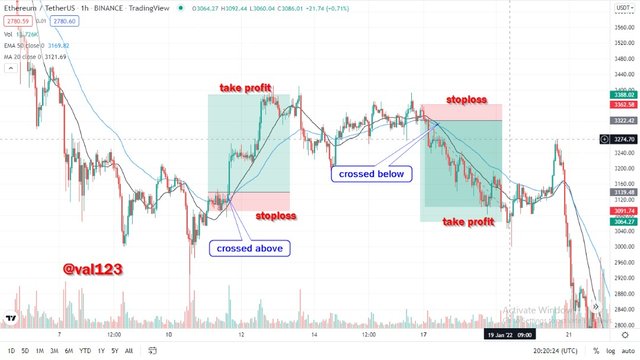
Using this two combined together, when the simple moving average which is the 20 period, crosses above the exponential moving average which is the 50 period, it signals a bullish trend and trader have to take a buy position at the moment. Lets see screenshot below.
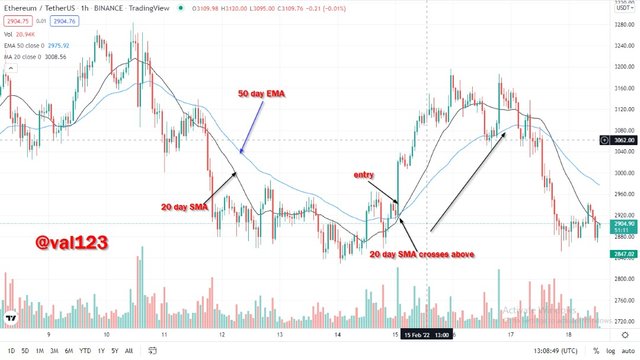
Now, we can see the chart i provided above. I have my 50 day EMA in blue colour and my 20 day SMA in black colour. When thr SMA crosses above the 50 day EMA, it indicates that the market is about to trend up. So we suppose to take a buy order.
Lets look at the exit point using the same method but the opposite. So when the 20 day SMA croses below the 50 day EMA and start going down, it signals a downtrend. Lets see screenshot below.
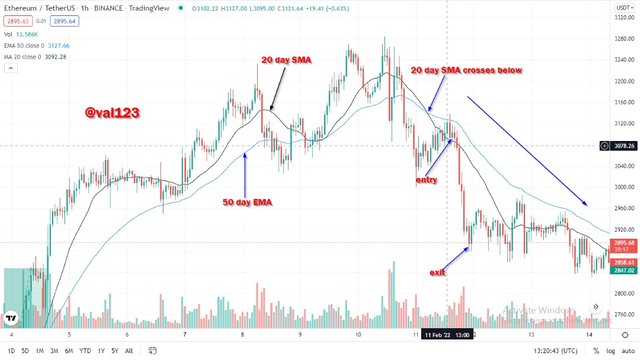
We can see how the 20 day SMA crossed below the 50 day EMA and the market start berishing, this is the perfect time to enter a short position.
Q4. WHAT DO YOU UNDERSTAND BY CROSSOVER? EXPLAIN IN YOUR OWN WORDS.
In this section, i will explain the moving average crossover. When this occurs, it simply means when there is a trend reversal and traders usually use the opportunity to take a buy or sell order. For example, we have a faster moving average and the slower moving average. When the faster moving average crosses over the slower moving average, it signals a buy order, traders usually take a buy position at that moment. Also, when the faster moving crossed below the slower moving average then it signals a bearish movement and this is the perfect time to enter a sell order. See screenshot below.
The screenshot above, we can see the moving average i.e the faster-moving average in black colour crosses over the slower moving average, there i took a buy order and also the faster moving average crossed below the slower moving average, which means that the trend has reversed to the downside and i took a sell position.
Q5. EXPLAIN THE LIMITATIONS OF MOVING AVERAGE.
We have explained the importance of moving average but we should keep in mind that this indicator is not 100% accurate, so we are not advised to base on a particular indicator while trading. We will discuss the limitations of moving average.
The indicator gives signal very late
Like i said earlier, its not 100% accurate, so this indicator sometimes gives false signal.
when trading in and out in a chopping environment the moving average is going to kick you out of the market.
CONCLUSION
Trading with moving average is very easy to understand. Using moving average we can be able to know when to enter the market and when to exit the market. But we should be mindful of the limitations, to avoid kicking us out of the market which will lead to Loosing money. All thanks to professor @shemul21 for this lecture.