" [Confluence Trading.] - Crypto Academy / S5W6- Homework Post for @reminiscence01".


Hey guys!
Meet me again @val123, its another new week of the steemit cryptoacademy lectures which is season 5 week 6. This week, professor @reminiscence01 gave a great lecture concerning confluence trading, from which I was able to achieve a lot from it. Now, let's go straight to the questions.
When a trader make use of different tools or indicators when analyzing the market without depending on a particular indicator is known as confluence trading. To trade with confluence means that you are applying atleast two or three tools to analyze the market movement and not depending on a particular strategy.
Most traders do fall a victim, whereby they only make use of one indicator or trading analysis when trading and the market will go against their decision. This is not advisable for traders to make use of on indicator when analyzing the market price. We should have in mind that, this indicators or trading tool we use when analyzing the market is not 100% accurate i.e sometimes, it gives false signal and this may lead to going against your decison when trading.
What am trying to figure out is that, as a traders who wants to make a good trading decision should make use of confluence trading and not relying on a particular strategy which are not even upto 90% accurate. We all know that cryptocurrencies are volatile, but we make use of this strategy in order to manage risk while trading.
Again, for me, when am trading with confluence , i usually add different indicators and technical analysis in order to get accurate result about the trend. The indicators i love using are RSI, moving average, half trend and super trend indicators. Also, i love adding some technical anaylsis depending on the current trend of the market.
HOW A TRADE SETUP CAN BE ENHANCED USING CONFLUENCE TRADING.
Like i mentioned earlier, in order to make a good trading decision , we have to make use of confluence trading, by adding different strategies on the chart to get accurate result about the trend. I will explain how this works using a chart i provided below.
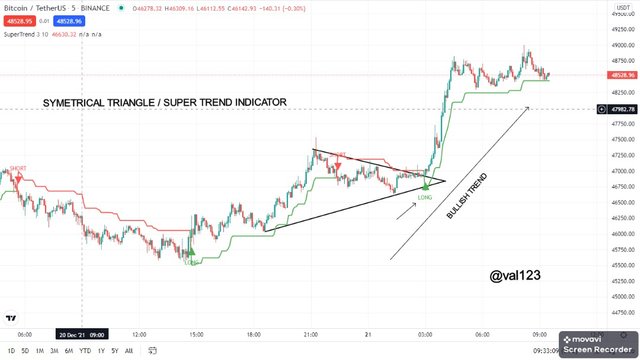
Lets pay attention to the BTCUSDT chart i provided above. I made this analysis using different strategies so as to get a better result before entering the market. At the chart above, i made use of super trend indicator and also added technical analysis called Symmetrical triangle. At the chart , we can see how the price moves up and down the triangle i drew, which perform the role as support and resistance point. There was a breakout at the up side which is the resistance level, though i was not fully convinced that the market will go more high after this breakout occured. So i added the super trend indicator, which also give me a buy signal, by pointing a green arrow at the buttom of the chart. Then the market started bullishing after the breakout.
Using confluence trading to make a trading decison is a very important thing to do when making a trade . Like i illustrated, using the chart i provided above, when the price breaks out at the resistance level, and also the indicator i used, indicated a bullish signal on the market in which i took my entry. These are the helps that confluence trading provides or gives us.
IMPORTANCE OF TRADING WITH CONFLUENCE
Setting up a good trade÷ Trading with confluence allows traders to be able to make a good setup during trade.
Give Better result÷ Now, trading with confluence trade gives us accurated result on the trade we are making. So this means that, if we want to get a better result about the next trend, we should make use of confluence trading and not depending on one strategy.
Filters false breakout÷ Using Confluence trading can help us to filter false breakout during trade. Like sometimes, while trading with a particular tool or indicator, it gives false signals and which can make us to fall a victim of trading at that moment that might cause loss. So when you add different indictors or tool, each of them gives their own signal, this will make you as a trader to filter out the one that it false or giving the wrong signal.
Risk management÷ Trading with confluence helps traders on how to manage risk and this can increase ones knowledge in trading.
Confluence trading can be carried out by 2 level confirmation or 3 level confirmation, before making a trade decision. Now lets see the explanation below and how to use it on a chart.
EXPLAINING THE 2-LEVEL CONFIRMATION CONFLUENCE TRADING
The 2-level confirmation confluence trading is when a trader applies at least 2 strategies on a chart before making any move to enter the market. This can be adding 2 different indicators or performing technical analysis and adding indicator along with it in order to give you a better outcome or signal. Lets see the chart i provided below.
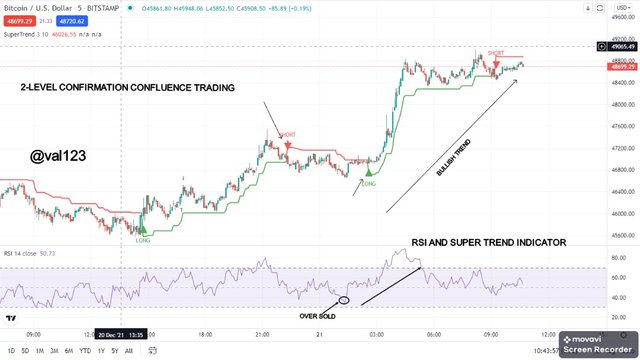
Lets pay attention to the chart above, i made use of BTCUSD. So as we can see at the chart, i was using 2-level confirmation confluence trading which i made use of two different indicatiors, The RSI indicator and The super trend indicator. If we look at the RSI indicator we can see that the market was over sold at first, which signals that a bullish trend will take place. Also, the super trend indicator signals a long position as we can see the green arrow at the buttom of the chart. So with this two indicators, i have hope that the market will bullish and we can see on the chart that the market experienced bullish trend after the signal.
EXPLAINING THE 3-LEVEL CONFIRMATION CONFLUENCE TRADING
The 3-level confirmation confluence trading is when a trader applies at least 3 strategies on a chart before making any move to enter the market. This can be adding 3 different indicators or performing technical analysis and adding indicator along with it in order to give a better outcome or signal. Lets see the chart i provided below.
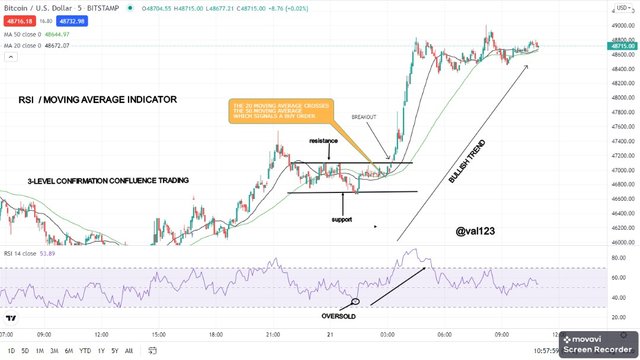
The chart above, i made use of 3-level confirmation confluence trade, whereby i added RSI indicator, moving average and then rectangle buttom, which was the technical analysis I carried out. Now there are two moving average, the 20 moving avearge which i coloured black, moved above the 50 moving average which i coloured green, this gives a bullish signal. Also the RSI indicator shows over bought which also gives a bullish signal. Then the rectangle pattern, used in trading of breakout. A breakout happened at the resistance point, which also gives a bullish signal.
With all this thing carried out, will give a trader perfect result on when to enter a market.
OPENING A DEMO TRADE WITH BTCUSDT CHART.
The chart below, is BTCUSDT chart which i perform a trade making use of 3-level confirmation confluence trading.
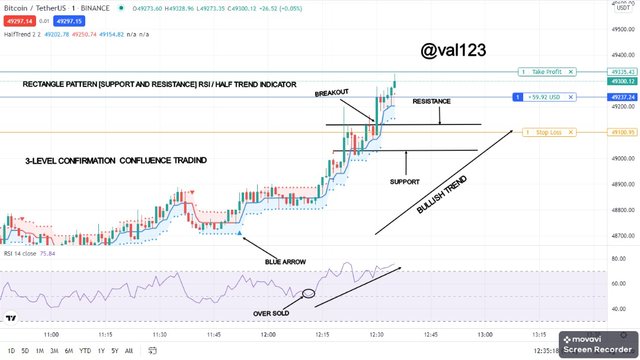
Considering the chart above, i made use of 1 minute timeframe to perform this demo trading. Also i made use of 3-level confirmation confluence trading. I used the RSI, the half trend indicator and as well added technical anaylsis using rectangle pattern which i drew two trendline in horizontal movement performing the role as support and resistance level.
All this strategies gave me and uptrend signal. As we can see the RSI indicator when it was over sold and gives a bullish signal and also the half trend gives a bullish signal to when the blue arrow appears at the downside of the chart. Then the rectangle pattern in form of a ranging market gives a bullish signal too when the breakout occurs at the resistance point and the market tends to bullsih.
Now, with all this, i was comfortable with it and then decided to take my entry at 49237.24 and then my take profit at 49335.43, my stop loss at 49100 using 1 BTC. At the stoploss point, i normally adjust the price. As we can see the profit am making in long position.
The 3 strategies i used are The half trend indicator, The RSI indicator and rectangle pattern.
Half trend÷ Half trend is seen as an indicator that signals or shows traders the trend that is about to happen. Now using half trend indicator, whenever you see a blue arrow which appear at the buttom of the chart shows a bullish signal and whenever you see a red arrow appear at the top of the chart, shows a bearish signal.
RSI÷ RSI indicator is also seen as an indicator that signals or shows traders the trend that is about to occur. Now, using the RSI indicator, whenever the price is being over sold shows a bullish signal and whenever the price is being over bought, shows a bearish signal.
Rectangle pattern (support and resistance)÷ The rectangle pattern are technical analysis most traders carries out in order to make a good entry, either long or short. A breakout can occur in either support or resistance level. So the trend or struggle between buyers and sellers are equal till a breakout occurs either up or down.
Using this strategies, each tools or indicator signals its movment. But although all of the strategies are showing the same signal.
The half trend indicator shows a bullsih trend when the blue arrow appears at the buttom of the chart and the market started trending up as we can see at the chart i provided.
The RSI indicator also shows a bullish signal, when the market was over sold and then it started trending up.
Rectangle pattern, shows a bullish trend signal, as we can see when a breakout occurs at the resistance level. Then the market start trending up.
OPENING A DEMO TRADE WITH SANDUSDT CHART.
The chart below, is SANDUSDT chart which i perform a trade making use of 2-level confirmation confluence trading.
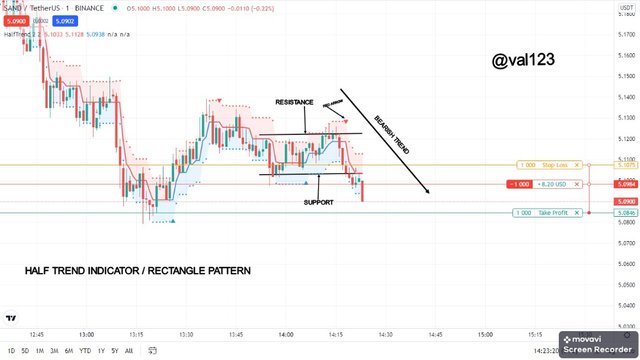
Considering the chart above, i made use of 1 minute timeframe to perform this demo trading. Also i made use of 2-level confirmation confluence trading. I used the half trend indicator and as well added technical anaylsis using rectangle pattern which i drew two trendlines in horizontal movement performing the role as support and resistance level.
All this strategies gave me a downtrend signal. As we can see the half trend gives a bearish signal when the red arrow appears at the upside of the chart. Then the rectangle pattern in form of a ranging market gives a bearish signal too, when the breakout occurs at the support point and the market tends to bearish.
Now, with all this, i was comfortable with it and then decided to take my entry at 5.0984 and then my take profit at 5.0846, my stop loss at 5.1075 using 1000 SAND coins . As we can see the profit am making in short position.
The 2 strategies i used are The half trend indicator and rectangle pattern.
Half trend÷ Like i have explained earlier, Half trend indicator signals or shows traders the trend that is about to occur in a given timeframe. Now using half trend indicator, whenever you see a blue arrow which appear at the buttom of the chart shows. A bullish signal and whenever you see a red arrow appear at the top of the chart, shows a bearish signal.
Rectangle pattern (support and resistance)÷ The rectangle pattern are technical analysis carried out by most traders to be able to make a good entry and decision, either long or short. A breakout can occur in either support or resistance level. So the trend or struggle between buyers and sellers are regarded as 5050 till a breakout occurs either up or down.
Using this strategies, each tool signals its movement in a given time. But although all of the strategies are showing the same signal about the bearish market.
The half trend indicator shows a bearish trend signal when the red arrow appears at the top of the chart and the market started trending down as we can see at the chart i provided.
Rectangle pattern, shows a bearish trend signal, as we can see when a breakout occurs at the support level. Then the market start trending down.
Its very essential for a trader to trade with confluence. This will increase his or her trading ability. Trading with confluence also makes trades to be successful. So i can say that trading with confluence is what every trader should learn how to apply. All thanks to professor @reminiscence01 for this wonderful lecture.
Cc- Professor @reminiscence01
Hello @val123, I’m glad you participated in the 6th week Season 5 of the Beginner’s class at the Steemit Crypto Academy. Your grades in this task are as follows:
Observations:
The RSI is not considered oversold at this point. A reading below 30 is considered oversold on the RSI.
Recommendation / Feedback:
Thank you for participating in this homework task.