Crypto Academy Week14 Homework Post for @fendit - Elliott Wave Theory.
Hello, fellow Steemit users. I learnt a lot about the Elliot Wave Theory through my professor @fendit's post. Now, I will begin to my knowledge to test and prepare the homework post that I am tasked with preparing.

Share your understanding on this lecture by answering the following questions:
Q1. What's the application of this theory?
Elliott Wave Theory is a theory which was designed for the technical analysis of the market using graphs and lines, in order to predict the price range and the market trend for a certain period of time so that the investors could buy or sell their stake in a particular asset.
This theory was introduced by Ralph Nelson Elliott, an American accountant, and author. He had studied the market, its trends, and patterns for several years before coming up with this theory. The basis of his theory was based on the investor's psychology and sentiments. He very clearly stated that the market is dominated and controlled by the investor's mindset and this psychology could very well be understood if one was to understand and carefully study the market trends. Through his theory, Elliott studied the market in detail and made predictions on the market's outcome. He published this theory in the book titled The Wave Principle in 1938.
This Elliott Wave Theory is very well applicable for depicting the market trend and prices through understanding the investor's mindsets. The theory is one of the important tools for technical analysis. If applied carefully by an investor, then they might be able to prevent themselves from incurring a loss. Through this theory, a trader might be able to spot the entry and exit points for them through the chart formation.
Q2. What are impulse and corrective waves? How can you easily spot the different waves?
As we all know that the Elliott Wave Theory utilizes chart and wave patterns to demonstrate the outcomes. There are primarily two types of waves - Impulsive and Corrective. We will be able to spot the difference between them once I explain them in detail -
IMPULSE WAVES -
Impulsive waves refer to the first five waves of the eight-wave market cycle. These waves are pretty easy to spot. They are always in the direction of the market trend, whether the market is bullish or bearish. The only difference in both the cases is that in a bullish market trend, the waves are in an upwards direction whereas, in a bearish market trend, the waves are in a downward direction. Also, out of the five impulsive waves, not all of them are in the same direction. Out Of the five waves, two are in an opposite direction and are smaller in length compared to the remaining three. There are three important points when spotting impulsive waves -- The second wave cannot retrace the first wave completely.
- Among the waves one, three, and five, the third one cannot be the shortest.
- The fourth wave cannot be longer than the third wave.
For there to be an impulsive wave structure present, these three points must be valid.
CORRECTIVE WAVES -
The corrective waves are the remaining three waves of the eight-wave cycle. They are in a direction opposite to that of the market trend in both, a bullish market and a bearish market. This implies that if the market is bullish, then the waves are in a downward direction whereas if the market is bearish then the waves are in an upward direction. That's how these waves are spotted. Corrective waves can arrange themselves in three different ways - zigzag, flat, and triangle. Out of the three waves in corrective waves, two are in the same direction, while one is opposite to them.Q3. What are your thought on this theory? Why?
As per my view, the Elliott Wave Theory does represent the mindset of an investor to some extent, however, it is not completely applicable everywhere. The theory helps to understand the market trends and predict the market trends in some cases, but often at times, the prediction can be wrong. An investor often has trouble identifying consistently when the Elliott wave begins and ends. The theory is prone to subjective revision, hence a decision once made has to be checked at regular intervals.
I often find it that the Elliott waves are spotted once the trend is over, this is because they are pretty difficult to spot completely. Trading using Elliott Wave Theory is very difficult. This is because when you are doing intraday trading, your decisions and predictions need to be quick and precise, whereas this theory needs time to spot, and before you realize you might lose your profits. There are often times when the market pulls back its general form while the theory might suggest it to be otherwise. Thus, I believe that the Elliott Wave Theory is not absolute in nature and it is not applicable everywhere when it comes to the market.
Choose a coinchart in which you were able to spot all impulse and correct waves and explain in detail what you see. Screenshots are required and make sure you name which cryptocurrency you're analyzing.
To answer this question, I would like to represent the graph of Bitcoin from Jan 2021 to the present date.
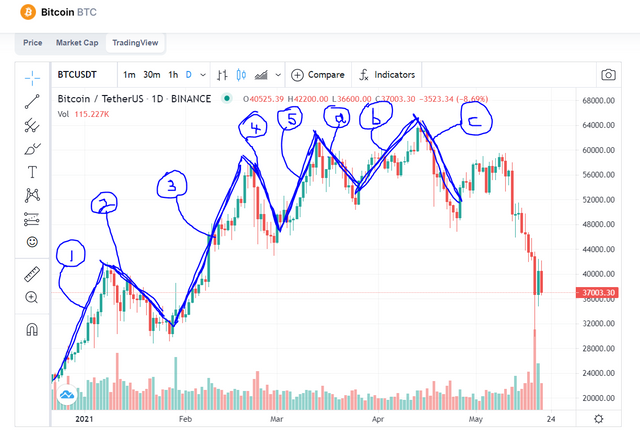
As you can see from the graph that Bitcoin follows a bullish trend. I have market the different waves that can be spotted from the graph.
Let's first check whether the three rules for impulse waves hold true or not.
The graph shows that the second wave is smaller than the first wave. Hence, the rule stands corrected.
It is visible from the graph that the third wave is the longest. Hence, the second rule stands corrected.
It can also be seen that the fourth wave is not longer than the third wave. Hence, the third rule stands corrected.
Thus, these rules are valid in this graph. Also, the corrective waves seem to follow a different trend. Hence, this example stands valid. Now, I will start with explaining my view -
Wave 1 shows that the investors started investing in the cryptocurrency which led to the value of the cryptocurrency increasing and its graph going upwards.
Wave 2 depicts that the investors sold their stake and claimed the profits, hence the graph started plummeting. But this downfall is not so severe that it will bring the price even below the start of Wave 1. It is just a small regression.
Wave 3 is the longest wave. It predicts that several investors started buying in this cryptocurrency which led to its price increasing considerably. Hence, an upward slope. This trend is usually seen when there is some popular news spread for a cryptocurrency.
Wave 4 is similar to Wave 2 where some investors sell their profit and the graph goes down a bit.
Wave 5 depicts an increase in price. This is caused by bullish traders who purchase the cryptocurrency. This often makes it overpriced.
Conclusion
Now, to conclude this post I would like to say that I learnt a lot about the Elliott Wave Theory by writing this post. I learnt about the mechanism, process and rules of The Elliott Wave Theory. I learnt how to spot this pattern in the graphs of cryptocurrencies. By working on the second part of the assignment I went through the graphs of many cryptocurrencies and I was able to learn a lot. Lastly, i would like to thank professor @fendit for this homework task.
Thank You.
This post is set to 100% power up.
Here is the link to my tweet
https://twitter.com/Vaibhav35079677/status/1395796784530673668?s=19
Here is the ss of my tweet
Thank you for being part of my lecture and completing the task!
My comments:
Nicely done!
Explanations were really good and you showed the pattern correctly!
As a suggestion for next time, make sure you focus a bit more on applying markdowns... as that can get you a higher score :)
Overall score:
6/10
I will keep that in mind. Thank you for the review.
You have been upvoted by @sapwood, a Country Representative from INDIA. We are voting with the Steemit Community Curator @steemcurator07 account to support the newcomers coming into Steemit.
Engagement is essential to foster a sense of community. Therefore we would request our members to visit each other's post and make insightful comments.
Thank you.
Thank you for the visit 😊.