[Candlestick Patterns] - Steemit Crypto Academy Season 4 - Homework Post for Task 10
1a) EXPLAIN THE JAPANESE CANDLESTICK CHART?(Original screenshot required)
b) IN YOUR OWN WORDS, EXPLAIN WHY THE JAPANESE CANDLESTICK CHART IS THE MOST USED IN THE FINICIAL MARKET
c) DESCRIBE A BULLISH AND A BEARISH CANDLE. ALSO, EXPLAIN ITS ANATOMY. (Original screenshot required)
Source
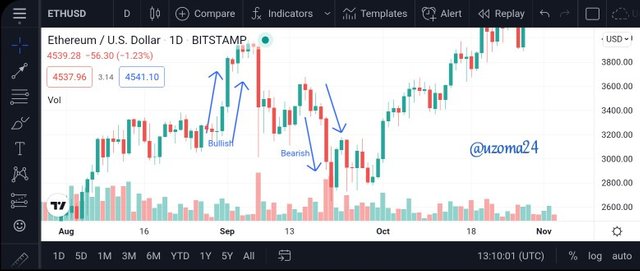
The Japanese candlestick is a type of candlestick that indicates or specifies the interactivity between buyers and sellers in crypto market. This Japanese candlestick was invented by a rice trader from Japanese who's name is munehisa homma and also was publicize or promoted by a broker called Steve Nison. Japanese candlestick indicate price motion in the market, because is noticeable and easy to understand, that is why most traders make use of it to foretell what price will be in the future or time to come. The Japanese candlestick show the opening and closing, the low and the high in a specific timeframe i.e when the close is above or higher than the open price that means the body of the candlestick will turn green that means that the market is positive, when the close is now lower than the open price, that means the body of the candlestick will turn red, this shows that the market is negative. Also it's very easy to use and easy to understand. The Japanese system of viewing chart is one of the most popular way of viewing charts.
Japanese candlestick chart is mostly use in finicial market due to the fact that is easy and simple to use and understand just by giving it one single look. Most traders used it to analyse the movement of market, to know indicated whether is in bullish trend or bearish trend, this can help tell who is comtrolling the market, wether thr buyers or the sellers and it's one of the help which japanese candlestick gives, because by looking at it, it will tell you the perfect time of purchase om crypto coin and the perfect time to sell it off too. It provides all the information or data on the movement of price in the market. The colour of the candlestick is visible and it makes very easy to indicate.
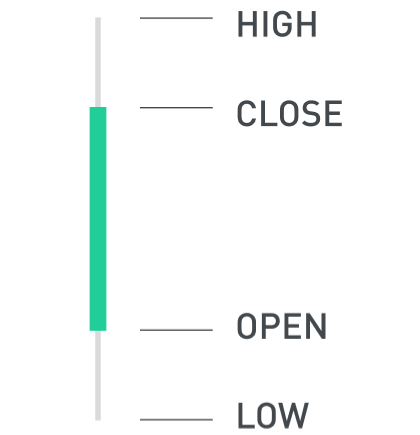
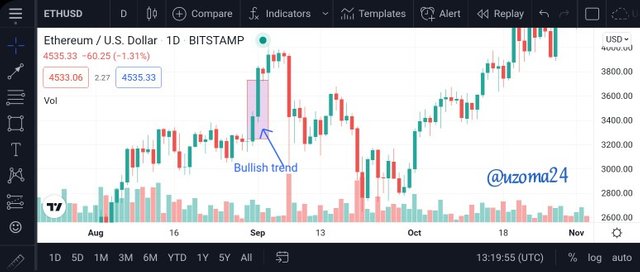
A bullish candlestick is mostly in green color or white color. Bullish candlestick indicate the positive move in the market price, which means that buyers have taking control of the market. When the market is bullishing, it shows that collabrators or shareholder have hope that the market will rise. Bullish candlestick serve as indicator to traders to know market is in uptrend period which shows that bulls are in charge of the market. It also allows all the quality of candlestick such as high, low, open and close, upper and lower shadow and the real body.
The open÷ This identify the beginning price in an asset in a given timeframe, which is mostly found under the bullish candlestick.
The Close÷ This identify the closing price in an asset in a given timeframe, which is mostly found over the bullish candlestick.
High÷ it identify the maximum asset being purchased in a given timeframe.
Low÷ It identify the smaller or minimum asset being purchased in a given timeframe.
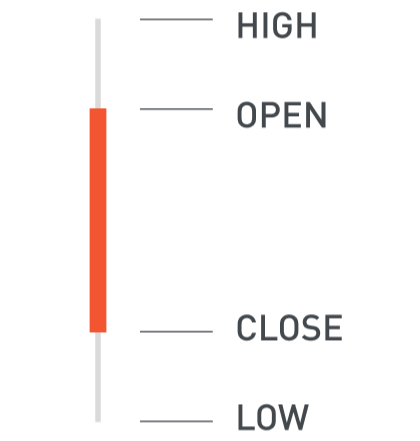
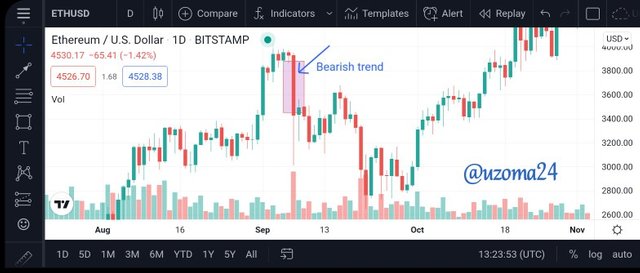
A bearish candlestick is mostly red in color or black in color. Bearish candlestick indicate the negative move in the market price, which means that sellers have taking control of the market. When the market is bearishing, it shows that collabrators or shareholder have hope that the market will descend. Bearish candlestick also serve as indicator to traders to know market is in downtrend period which show that buyers are in charge of the market.
The open÷ This identify the beginning price in an asset in a given timeframe, which is mostly found over the bullish candlestick.
The Close÷ This identify the closing price in an asset in a given timeframe, which is mostly found under the bullish candlestick.
High÷ it identify the maximum asset being purchased in a given timeframe.
Low÷ It identify the smaller or minimum asset being purchased in a given timeframe.
CONCLUSION
The lecture about thr Japanese candlestick was very awesome and beneficial, i really learnt a lot of things about it and how traders can be able to identify what's the current price movement.
Thanks for stoping
Please do not use the #club5050 tag unless you have made power-ups in the last month that are equal or greater than any amount you have cashed out.