Homwork post for @kouba01 || Bollinger bands || @utsavsaxena11
Hello steemians how are you I hope you are doing well and you all are safe and healthy during this pandemic time. So today Professor @kouba01 take another great lecture on indicators and today professor discuss about Bollinger bands Indicator.
This lecture is totally based on our research and understanding. we all know Indicators are used to analyse prefect Trend to save ourself from loss during trading.
I am submitting my homework post to professor.
Homwork

Question 1 :
Define the Bollinger bands Indicator by explaining it's calculation method, How does it work ? What is the best Bollinger Band set-up.

Answer 1 :
Bollinger band is a technical indicator that was developed by sir John Bollinger in late 1980. It is useful for both short trem and long term traders. It help trader to easily identify the mark range. It is a technical indicator based on simple moving averages. These moving averages work as resistance and support or trend Indicators in a market. Bollinger band Indicator also develop to generate and identify overbrought and oversold condition as other Indicator like RSI and Stochastic does. It also help to find volatility in the market. It consists of three different bands upper band, middle band and lower band .
| Advantages | Disadvantages |
|---|---|
| Its is very much useful with ranging market. | Better for sideways market as compare to trending market. |
| Middle band have many Support and Resistance lines | generate false signals during trend reversal. |
| Easily indentify the volatility of the market | Only work with price movement no predictions. Consider as lagging indicator.q |
How to add Bollinger band in tradingview :
- Search tradingview in search engine.
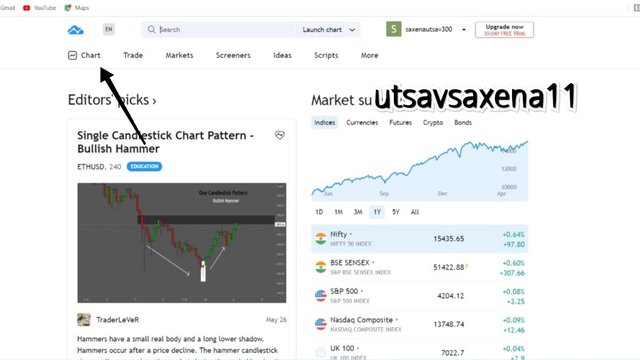
- Select the chart on which you want to apply Bollinger band.
- Now click on " fx " and search BB.
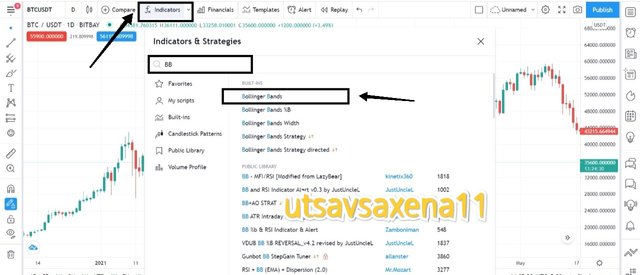
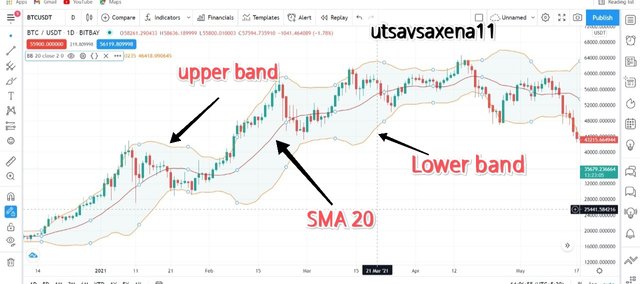
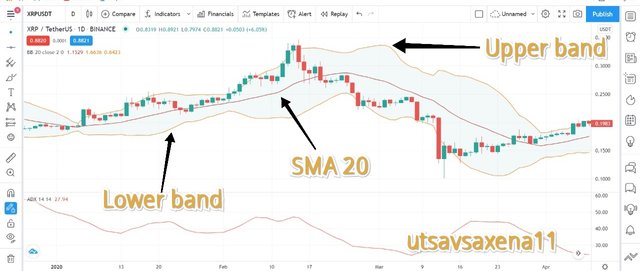
- You can see three band on price chart. The upper band is known as Upper standard deviation . The lower band is known ad lower standard deviation. Middle band is known ad simple moving average {SMA}.
Calculation :
To calculate moving averages of the security we have to use the formula i.e. : -
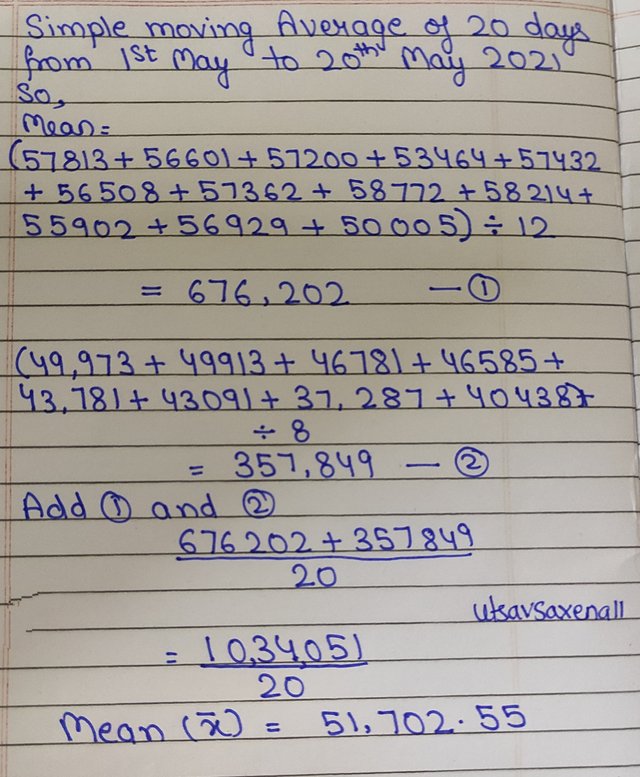
Middle Band = 20day simple moving average (SMA)
Upper Band = 20day SMA + (20-day standard deviation of price x 2)
Lower Band = 20day SMA – (20-day standard deviation of price x 2)
Example :
let us take an example of BTCUSD from 01/05/2021 to 20/05/2021 .
Focus on closing price only
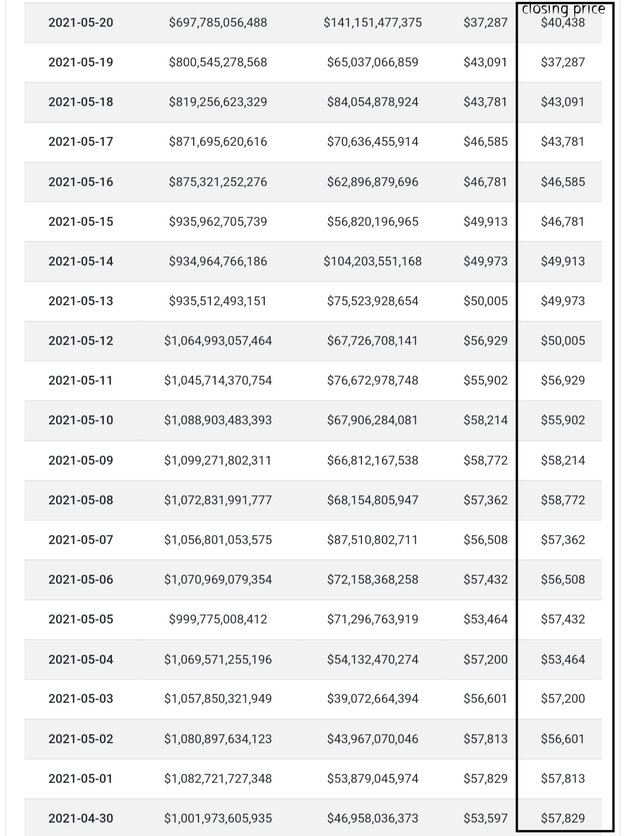
- Take mean of these 20 days closing price :
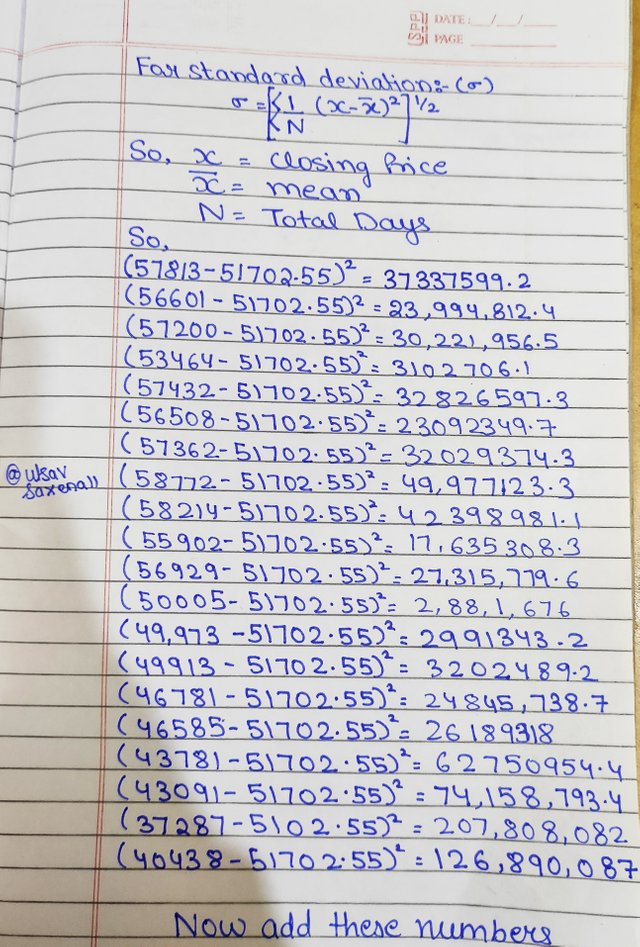
- Calculate standard deviation using the formula given below .
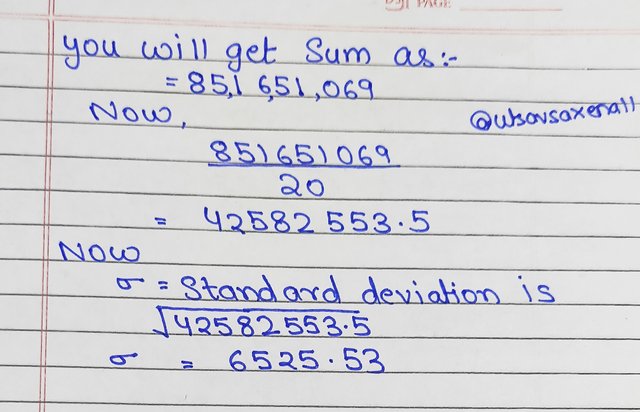
- Calculate upper band using Upper Band = 20day SMA + (20-day standard deviation of price x 2)
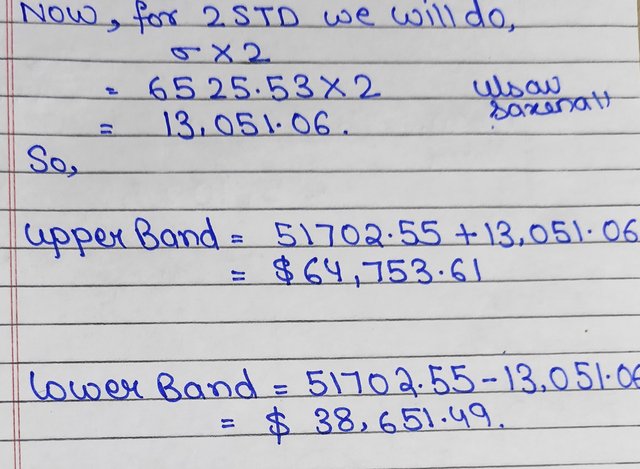
Calculate lower band using Lower Band = 20day SMA – (20-day standard deviation of price x 2)
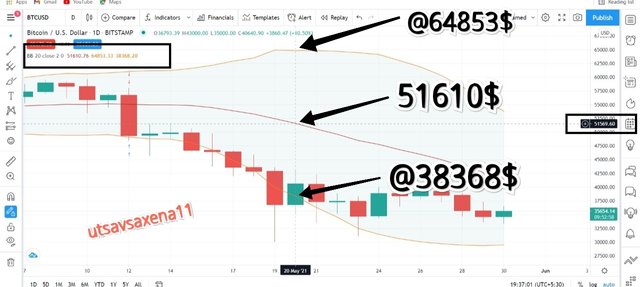
You can see the graph here in between the dates. Observation and calculation sai nearly equal.
Working of Bollinger bands :-
The working of bollinger band is based on total technical analysis by the trader. Let us see what are the steps of working:
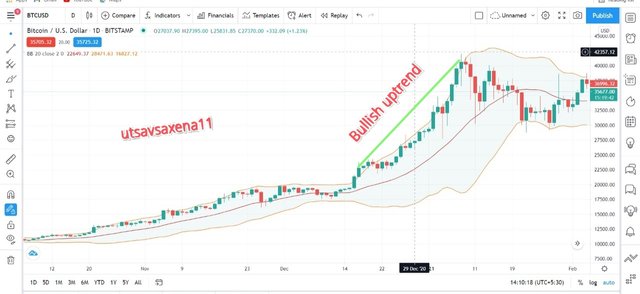
- When price touches the upper band and move upward with the trend of the market then is considered to be in the bullish trend. Then at this point investor and trader must know that it is not perfect time to sell.
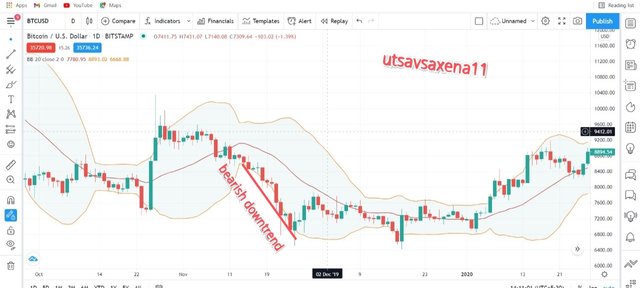
- When price touches the lower band and move downward with the trend of the market then market is considered to be in the bearish trend. Then at this point or situation investor and trade and must know that it is not perfect time to buy.
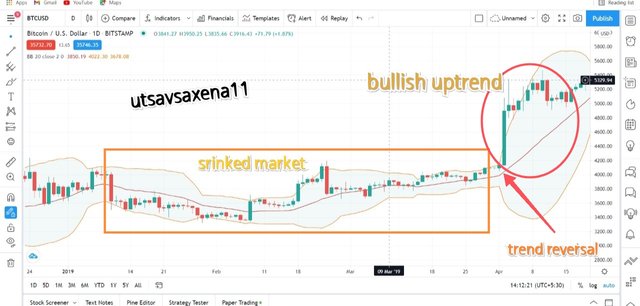
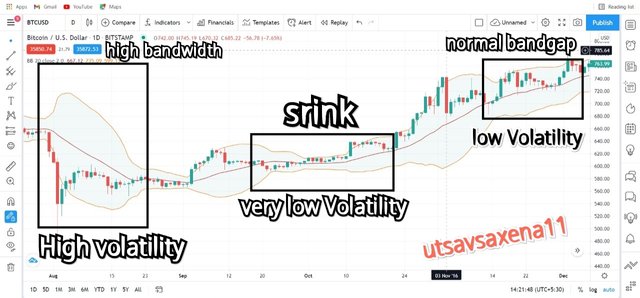
- When bollinger band shrinks then it work as an indication that a trend reversal will take place. That trend can be bullish or bearish.
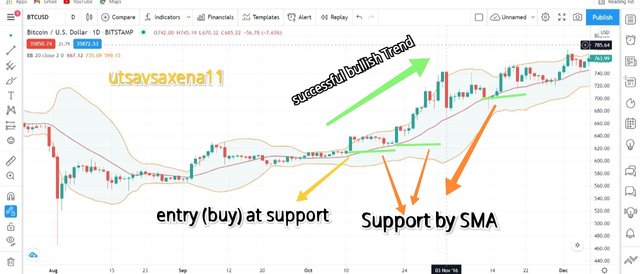
- When price touches support from middle band and move towards upper band then this working situation considered to be successful bullish Trend and its and indication for trader to buy securities at the support line.
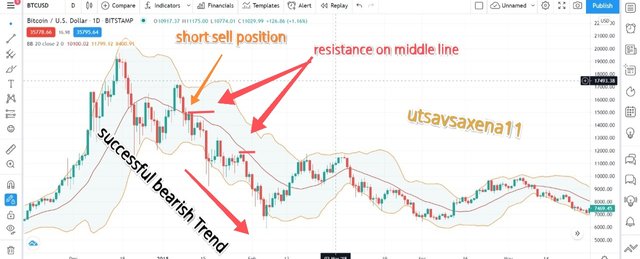
- When price takes resistance from middle band and move downward towards lower band then this situation is considered to be the the successful bearish Trend and it's time for the trader to sell the securities at metal resistance.
- When there is a large band gap then we can say that market has high volatility. When there is a very low volatility then the bandgap srinks and finally when there is a normal band with then the volatility in the market is low.
So , these are the working styles and steps of bollinger band to get high accuracy without suffering losses.
best setup for bollinger band:
Setup for bollinger band have simple moving averages and standard deviation full stop it consists of three bands lower band middle band and upper band.
The best setup for this bollinger band is the default setup that is :
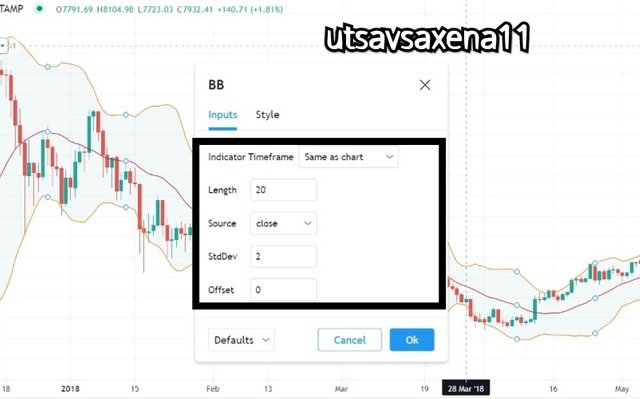
SMA(20,2)
Length :
It is the length of simple moving average which is by default 20.
StdDev :
It is the multiple of standard deviation of bollinger band width which is by default 2. It means that we have to multiply standard deviation with 2.
timeframe :
it represents the time at which we are analysis our data. We are using Same as chart.
This setup is considered to be best because:-
- It give us most analytic and researchful trend analysis.
- It is easy to understand volatility of market by using standard for default setting of bollinger indicator.
We can use other setup too but we have to change standard deviation accordingly :
| Length SMA (MIDDLE BAND) | STANDARD DEVIATION |
|---|---|
| 10 | 1.5 |
| 50 | 2.5 |
So, these are the basic information about bollinger band and its working. We will you be using standard or default setup for next questions too.
Question 2 :
What is a breakout? How do you determine it?
Answer :
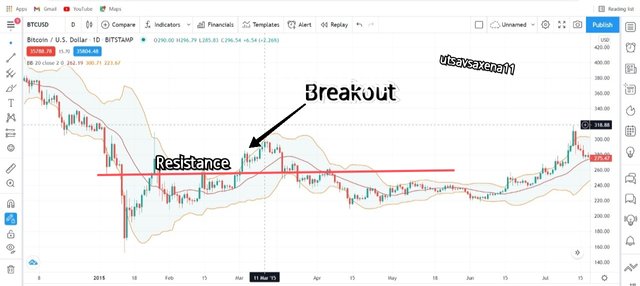
When the movement of price chart for price trend is out of the region that is defined by using indicators, resistance and support then the situation considered to be the Breakout situation.
uses of breakout :
- When breakout occur after breaking the support line then trader go for short position as they know that price will show down Trend and they can re buy that asset again and gain profit.
- When Breakout occur after breaking the resistance line then trader go for long position and gain over brought profit.
Break out is considered to be the technical chart pattern.
how to determine it :-
There are three methods to determine breakout if I consider situation of this homework :
In normal condition when price chat break support and resistance then we can easily determine the breakout. Now we will also try bollinger bands to determined breakout.
- When a price chart break the support line all the resistance line then in these two conditions we get a Breakout point where uh ine support line price move down Trend and in resistance line price will move up Trend.
- When price broke support and move below lower bollinger band then it is considered to be the Breakout situation. It tell us market will move down Trend. After this breakout trader see a trend reversal. Market move uptrend.
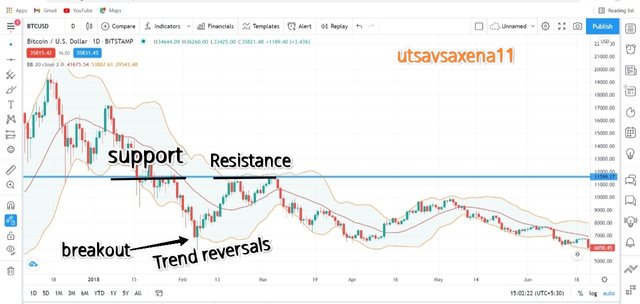
- When price broke resistance and move above the upper bollinger band that it is considered to be the Breakout situation. Sell before trend trun around and move downtrends.
So in these three different ways we can determine the Breakout point in a price chart using resistance and support and also bollinger band indicator.
Question 3 :
How to use bollinger band with the trending market ?
Answer :
It is very much easy to use bollinger band with trending market to calculate the exact entry and exit point.
Let us one by one each method using bollinger band to enter in the market or coming out of market.
upper band and uptrend :-
When price touches the upper band and move upward with the trending market the market is considered to be in the bullish phase of the market. But trader must understand that it is a not perfect selling situation.
Example :-
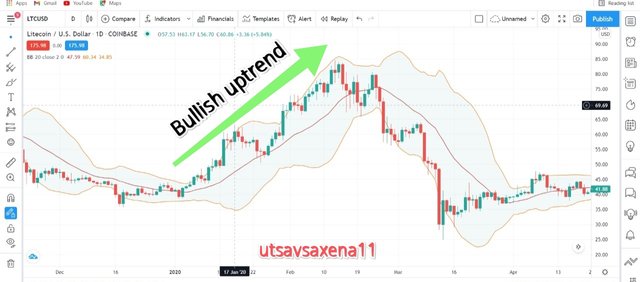
In the above LTCUSD pair we can see that price chart and upper band are moving together upward that is an indication of bullish trend.
lower band and downtrend :-
When price touches the lower band and move downward with the trending market. The market is considered to be in bearish phase of the market. But trader must understand that it is not a perfect buying situation.
Example :-
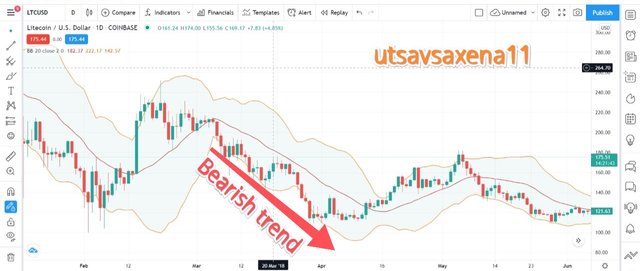
In the above screenshot we can see the LTCUSD pair in which we can see that price chart is moving down with lower band and below SMA 20 . This situation is not perfect buying situation.
Successful bullish Trend :-
When price touches support from the middle band and move toward upper band then this working situation is considered to be the successful bullish Trend and the perfect point of buying security when price make support at middle band.
Example :-
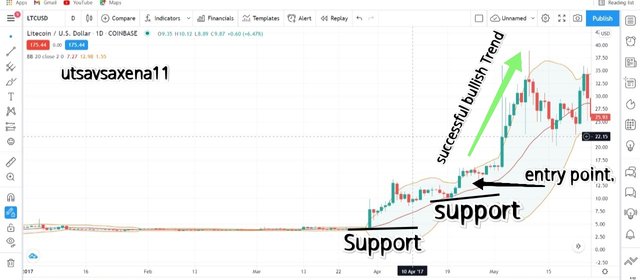
In the above LTCUSD pair we can see that price taking support from middle band and moving bullish Trend . So at second support we can buy or take entry in market.
Successful bearish Trend :-
When price take resistance from the middle band and move down towards lower band then this situation is considered to be successful bearish Trend. It is the time to sell the securities when price touches resistance of middle band.
Example :-
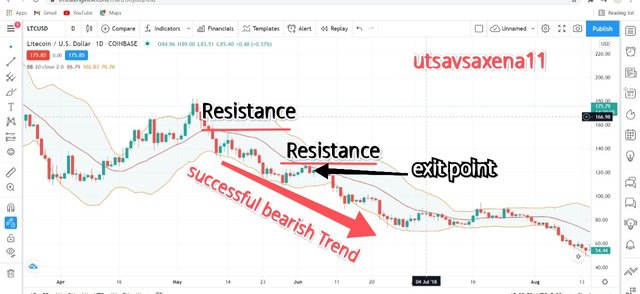
In the above LTCUSD pair we can see that price taking resistance from middle band and moving bearish Trend. So at second resistance we can sell or take exit out from market.
So, In these ways we can use bollinger band to follow trending market.
Question 4:
What is the best indicator to use with the bollinger band to make our trade more meaningful .
Answer :-
The best indicator that I will prefer to use with the bollinger band to make our trade more meaningful is is average directional index [ADX].
We all know that not every indicator is 100% perfect but with use of other indicator and analysis of both indicator will give a perfect entry and exit point in the market with reducing losses.
Sometimes bollinger band also provide false signal or meaningless signals which may give us a situation of loss. so by using average directional index we can easily predict the trend direction of the price chart and filter the false or meaningless signal.
Bollinger band+ ADX
Trader use a strategy that market in bollinger band when hit upper band then it is a exit point for selling point. And when market hit lower point then it is entry point or buying point. But when we use a ADX with bollinger band and ADX tell about trend reversal then bollinger band fail to work meaningfully.
steps:
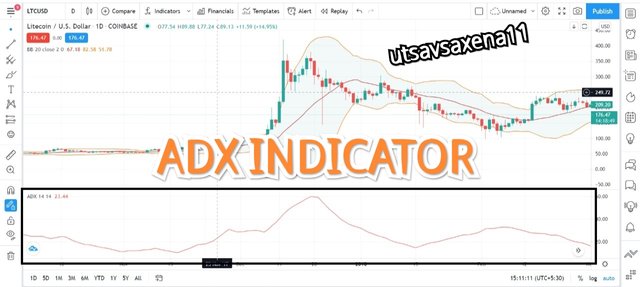
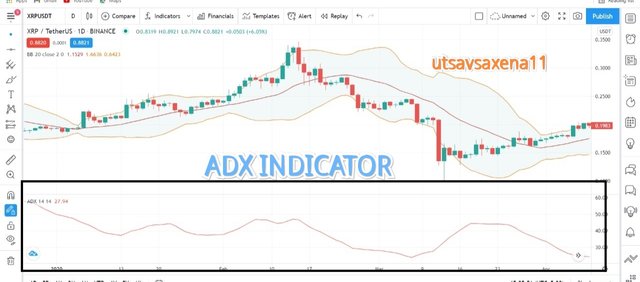
- Add average directional index in tradingview.
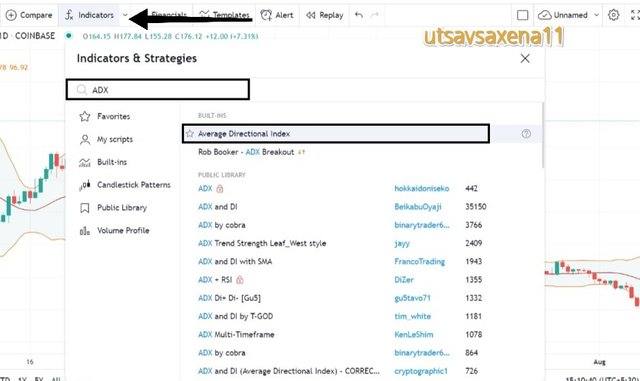
- You can see below the ADX INDICATOR red in colour.
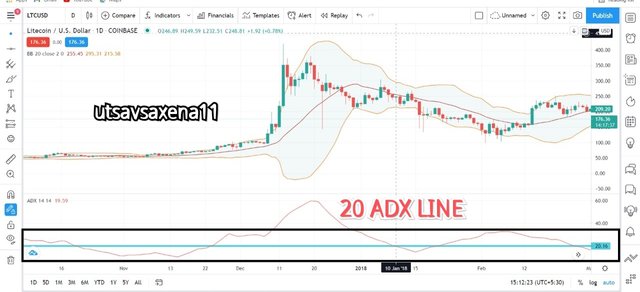
- Draw a horizontal line on 20 point Average directional index [ADX].
Now check the condition for trending and sidewise market.
Trending market according to ADX :- price line above 20 is considered to be the trending market in ADX.
Sidewise Market in ADX : priceline below 20 considered to be the sidewise market in ADX.When ADX position is below 20 then easily we can use our strategy of buying at lower band and selling at upper band.
Example :-
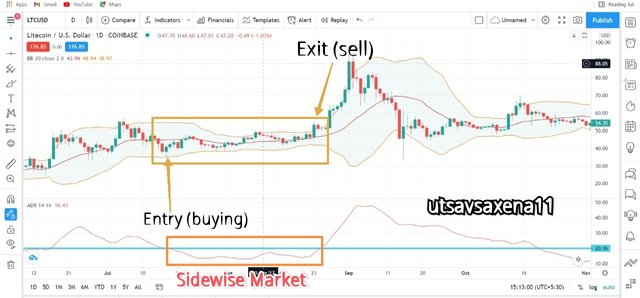
In the above screenshot we can see that sidewise is below 20 in ADX. so in this low Volatility market it is easy to enter and exit with profit. So we enter in the market at lower band and exit out when price touch upper band.
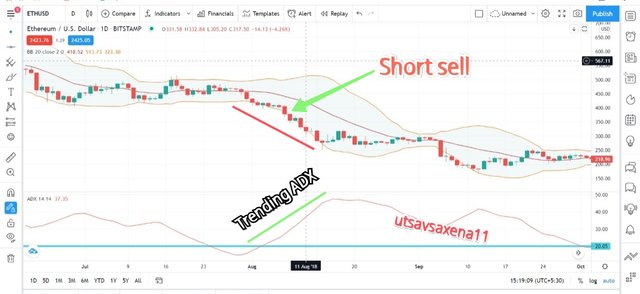
There is another way too in which we can play reversly with ADX and Bollinger band.
- If average directional index showing uptrend and bollinger band showing downtrend touching lower band then this is a position of short sell.
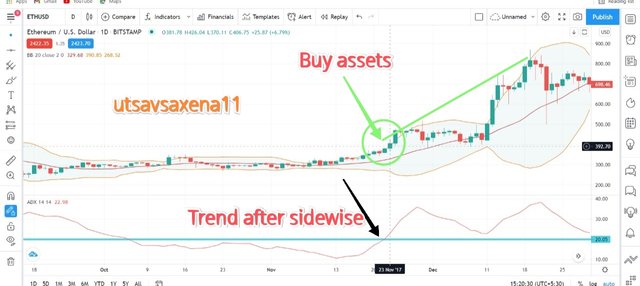
- If average directional index showing uptrend and bollinger band touch upper band, then the market will move uptrend and it is a point to buy that asset. As ADX support bollinger band in this situation.
So, in this way we can use ADX( AVERAGE DIRECTIONAL INDEX) with bollinger band for meaningful trading style with higher accuracy and minimum loss.
Question 5 :-
What timeframe does the bollinger band work best on? And why ?
Answer :-
Time frame is is defined as time which is used to complete a project in a given duration. For example we can take 5 minutes to 30 days in stock price charts.
Time frame always depend on trading analysis and research style . There are many different trading strategies trader use. In bollinger bands we can see the three different situations or I can say trading strategies in which we can take different time periods.
Intraday trading :-
If you are an intraday trader and close positions at closing market time then you must use the time frame of 5 minutes to 10 minutes.
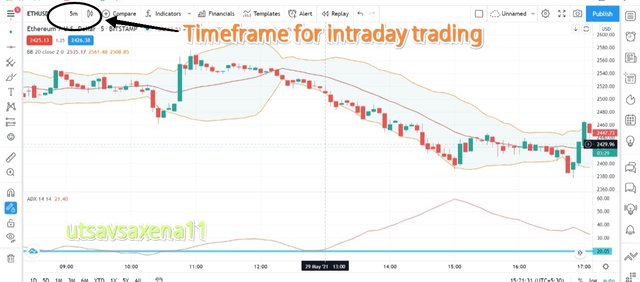
Reason :-
- It will help you to know volatility in the market and give you the perfect entry point.
- Short time frame in short trading give accuracy and profit to the trader.
So if you are using bollinger band in intraday trading then preferably use 5 minutes or 10 minutes time frame.
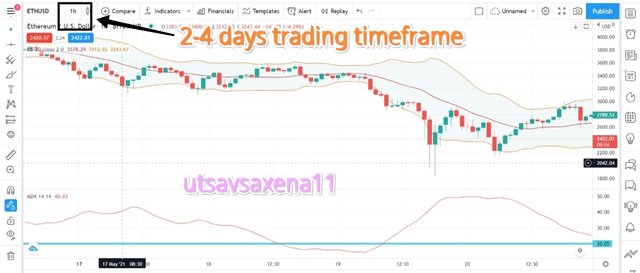
2-4 days trader :-
If you are holding your position for 2-4 days then I will recommend you to use 15 minutes 30 minutes for one hour time frame during analysis.
Reason :-
- Position holder always want to check market trend resistance and support.
- As they are holding for days so for more accuracy and profit they always prefer long or medium time frame.
- This time frame also provide perfect overbought and oversold condition for the trader.
- Also 1 hour for 30 minutes time frame in bollinger band provide us best lower band and upper band candlesticks.
Since it is a medium type trading so we are using Central time frame neither higher nor lesser time frame which will give us profit and perfect analysis.
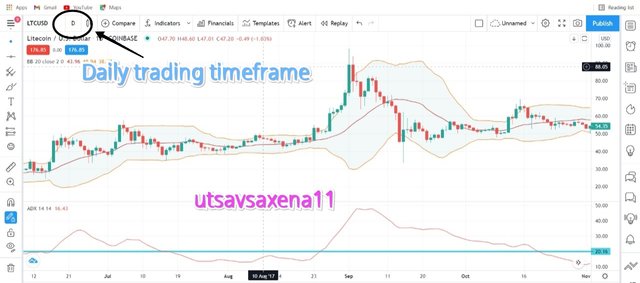
Long term trading :-
If you are a long term trader and hold securities for a long period of time then you must prefer daily chart time frame to analysis the trend.
Reason :
- Long-term holders always prefer long time frame because of small candlestick size.
- This time frame provide High accuracy and also profitable trade for long-term users.
- In such time frame it is easy to determine bullish and bearish Trend.
- It is easy to determine resistance, support and overbought oversold conditions.
With bollinger band larger time frame will be more accurate in long term trading.
So, in different trading style we can use different trading strategies and time frame with suitable analysis.
Question 6 :-
Review the chart of any pair and present the various signal giving by the indicator bollinger band .
Answer :-
So we are reviewing XRPUSDT DAILY timeframe chart as professor also use the same time frame. So let us see the main points of Bollinger bands and let us see the entry and exit points using filter and bollinger band Indicator.
SMA 20 , LOWER BAND , UPPER BAND :-
ADX :-
Overbrought and Oversold :-
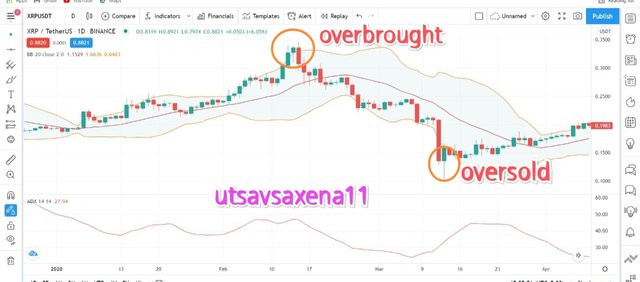
When price reached out upper band then it is overbrought condition and when price reached out lower band then it is oversold condition in XRPUSDT we can easily see this Trend.
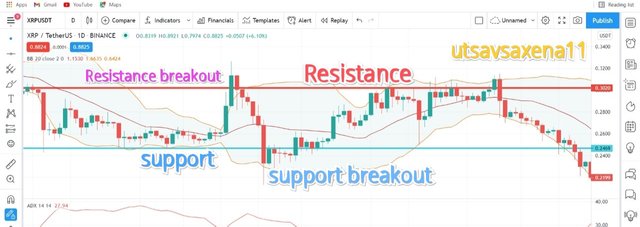
Support and Resistance :-
When price chart break resistance and support line then both are considered to be breakout situation.
In above situation we can easily see this Trend.
Bollinger band+ADX entry point or buying :-
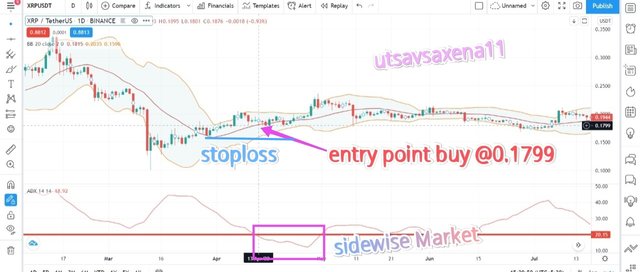
When ADX is below 20 then it is sidewise makret and we get an entry point and buy an asset at @0.1799 usd . As shown above.
Bollinger band+ADX exit point or selling:-
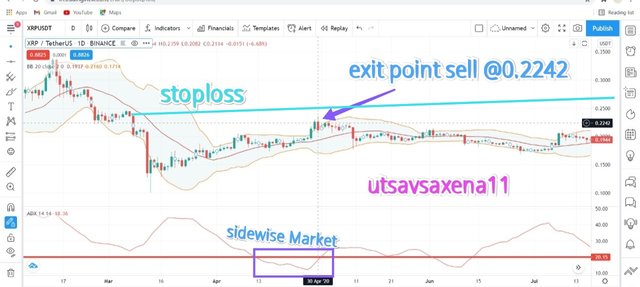
As we see that sidewise Market start moving towards trending Market and hover near 20 we get a perfect exit point and we sell our asset at @0.2242 usd.
After entry exit by ADX+bollinger band we gain profit of $0.0443 that is approximately ₹3.22 .
Entry with bollinger band :-
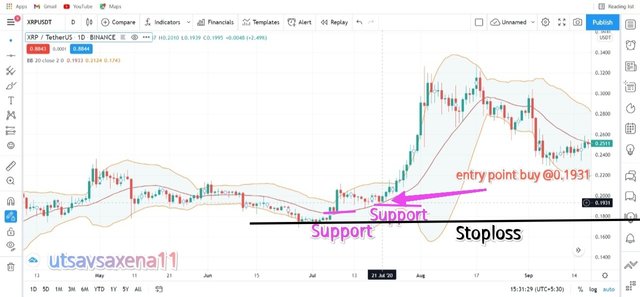
When price chart make support with middle band and move upward then at second support buy the asset. So here we enter in market at @ 0.1931 usdt.
Exit with bollinger band :-
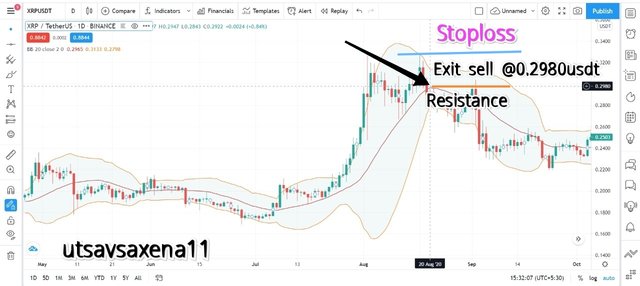
When price chart make resistance with middle band and move downward then at first resistance sell the asset. So here we exit in market at @ 0.2980 usdt.
After entry exit by bollinger band we gain profit of $0.1049 that is approximately ₹7.5 .
Bullish trend and Bearish trend :-
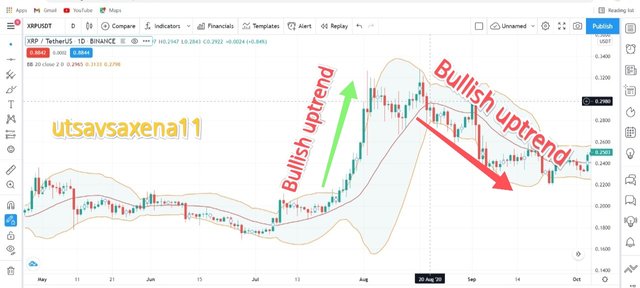
When price chart move upward with upper band then market is considered to be in the bullish phase and when price chart market is below middle line and move downward with lower band then it is Bearish trend.
Conclusion :
So now we are concluding our homework post. In this we discuss about bollinger band that it is a technical indicator use to analyse price trend and also find overbrought and oversold condition, volatility in the market etc. It consists of SMA 20 upper band and lower band. Then we move towards its calculation and observe the calculated value. Bollinger band use different style trading in trending market that we have discussed. ADX is one of the most suitable Indicator which can be used with bollinger band to get high accuracy and removing false reversal Trend signals. Father we discuss that for bollinger band if a trader is in a long position trading then they must choose a daily chart for analysis and research.
Thank you so much professor @kouba01 for such an amazing lecture. Learn alot!!!...
THANK YOU 😊
Hello @utsavsaxena11,
Thank you for participating in the 8th Week Crypto Course in its second season and for your efforts to complete the suggested tasks, you deserve a 10/10 rating, according to the following scale:
My review :
What can I comment other than excellent, excellent, excellent, really an interesting article in form and especially in content, because your answers were accurate and comprehensive for everything that is required with some additions that made the topic more useful.
Thanks again for your effort, and we look forward to reading your next work.
Sincerely,@kouba01
Thankyou so much professor it means alot to me. Looking forward to learn alot from you.
Sincerely,@utsavsaxena11
Amazing presentation from you.I learn and Understand very well from your lecture.
Nice Explanation with best Examples.
#affable #india
Thankyou so much lavanyalakshman ji.
Always welcome my friend.