Homework post for @kouba01 by utsavsaxena11 || Ichimoku Kinko Hyo Kumo cloud
Hello steemians how are you? I hope you all are doing well and you all are safe and healthy during this pandemic time. Hope we all soon get the vaccine.
Today I go through one of the best and simplest language explanation homework posts by @kouba01 on Ichimoku Kinko Hyo indicator Komu cloud. It's interesting to read the lecture post. Now I am Sub
mitting my homework post to the professor.
HOMEWORK

QUESTION 1:
Discuss your understanding of Kumo, as well as its two lines. (Screenshot required)
ANSWER 1:
Kumo is a cloud space in Ichimoku Kinko Hyo indicator which is used to determine trends in the market. It is the space that lies in between two lines named Senkou span A and B. This Komu Cloud also helps the trader to determine price momentum, Resistance and support of future and trends in the market.
When the Market is in an uptrend or bullish trend then Senkou span A is above Senkou Span B and move upward. When the market is in a down trend or bearish trend then Senkou span B is above Senkou Span A. There are three types of trends that Komu cloud can easily determine.
Uptrend
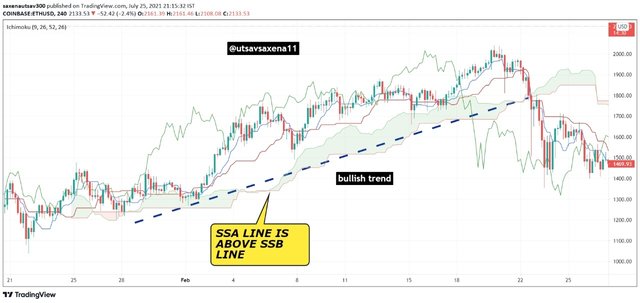
When the Market is in an uptrend or bullish trend then Senkou span A is above Senkou Span B and move upward.
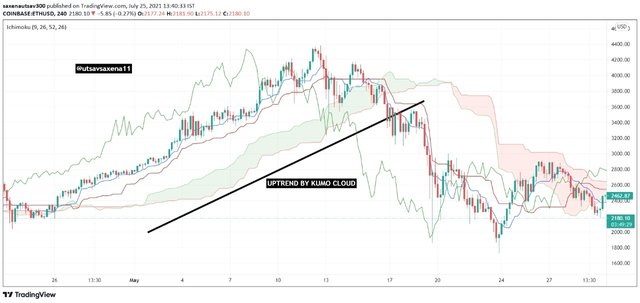
As you can see in the coinbase ETHUSD chart from 1st May 2021 to 20th May 2021 SSA is above SSB and hence market is showing an uptrend.
Downtrend
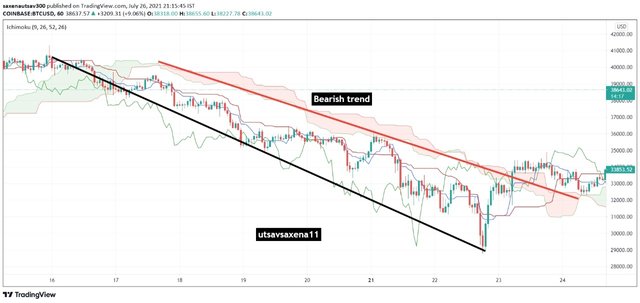
When the Market is in downtrend or bearish trend then Senkou span A is below Senkou Span B and move downward.
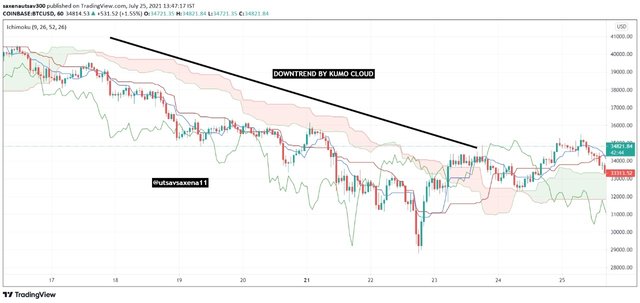
As you can see in the coinbase ETHUSD chart from 18 April 2021 to 24th April 2022 SSA is below SSB and moving downward. Hence it is showing a bearish market.
Sideways/Neutral trend
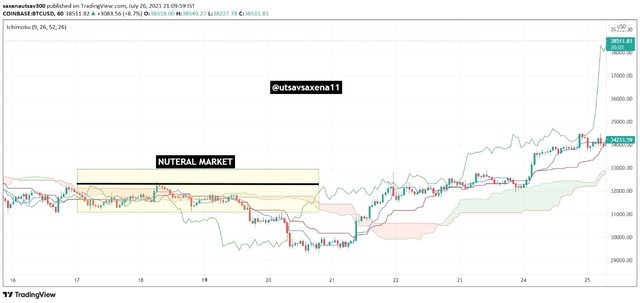
When SSA and SSB are moving in a flat level and don't create range then it is considered to be netural market ny kumo cloud.
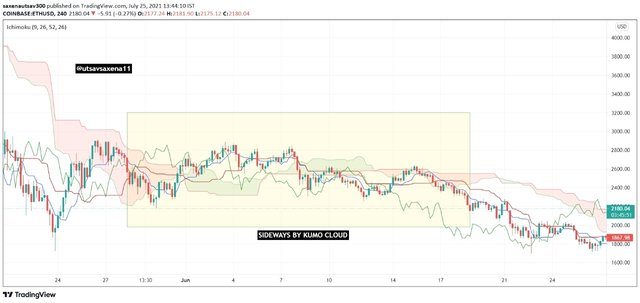
As you can see in the above coinbase ETHUSD chart from 28th May 2021 to 18th June 2021 the SSA and SSB are in Flat movement and price not change frequently. This Is a neutral market trend.
Now this cloud is bound in between two lines:
Senkou Span A
Senkou span A also known as the leading span A is one of the line of Kumo cloud. It is use to measure price movement and also provide support and resistance levels. It is calculated by adding tenkan-sen line with kijun-sen line and divide by 2, further we can create 26 period Moving average ahead. It also react very fast to price changes. When Senkou span A line is on top of Komu cloud then market is in bullish phase.
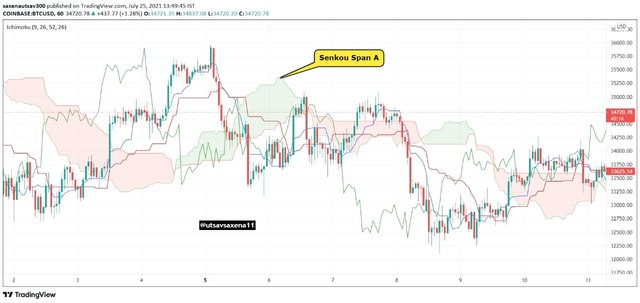
The above coinbase BTCUSD chart shows Senkou Span line A is above Senkou span line B and it says that price will move up in future and that we can see by candle sticks also.
Senkou Span B
Senkou span B also known as the leading span B is one of the line of Kumo cloud. It is use to measure price movement and also provide support and resistance levels. It is slow as compared to SSA. When the SSB line is above in Kumo cloud then it is considered to be bearish trend. It is form by calculating historical data and 26 period future value. Cross of SSA nad SSB will decide the trend change in the market.
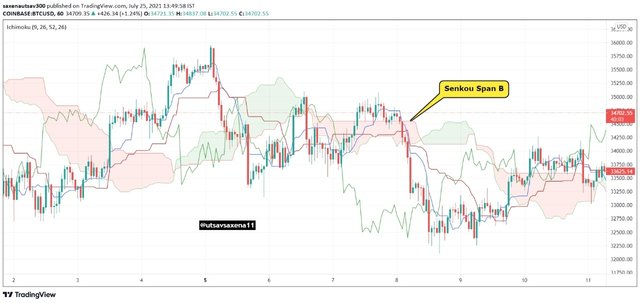
The above coinbase BTCUSD chart shows Senkou Span line B is above Senkou span line A and it says that price will be neutral for some time in future and that we can see by candle sticks also.
This is my understanding of Kumo cloud and Sinkou span lines.
QUESTION 2:
What is the relationship between this cloud and the price movement? And how do you determine resistance and support levels using Kumo? (Screenshot required)
ANSWER 2:
Kumo cloud consists of two span lines and the area in between the two. Price movement depends of three different criteria. First which span line is moving upward. If Span line A is above Span line B then price will move upward. If span line B move above span line A then price will move downward. The third case is very interesting and unique. It depends on thickness of the kumo cloud. Kumo cloud can be thick or can be thin. So How to check the price movement from that let is see that in the given chart below :
When Kumo cloud is Thick :
When kumo cloud are thick enough in both upward and downward market then there is a strong resistance and support and because of that prize will not penetrate the cloud and show good price movement depending upon the spanline movement.
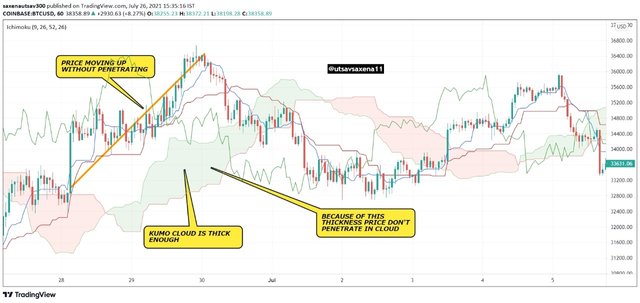
In the above coinbase BTC USD chart off one hour time frame you can see there is an up trending market cloud. In between the cloud the area is very thick it shows that prize will not penetrate inside the cloud and will move upward that we can see e that price is moving upward. This is a situation when span line A is above span line B.
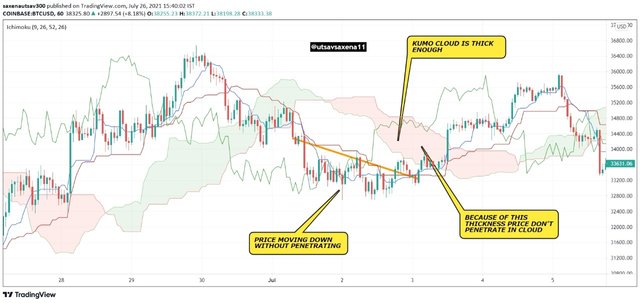
In the same coinbase BTC USD chart of 1 hour time frame after a twist the market move downward and we can see e flat span line with thick area which shows prize will not penetrate inside the cloud and will move neutral downward.
When Kumo cloud is thin :
When kumo cloud are thing then there is weak support and resistance created by the cloud and that can easily penetrate by by price. Also cloud thiness indicate towards an upcoming twist which mein show trend reversal or neutral market of upcoming price chart.
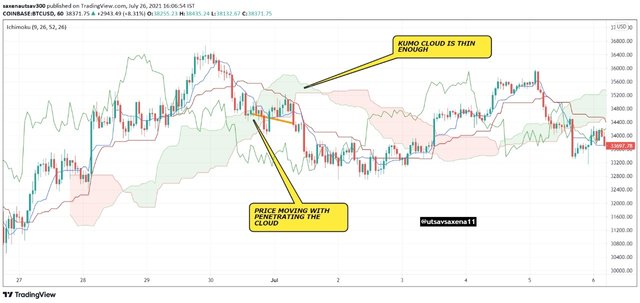
As you can see in the above BTC USD coinbase chart of 1 hour time frame there is a thinness in the market cloud. Then we can notice to situation that price penetrate the human cloud and move downward also so we can see a twist which indicates trend reversal that we can also see with the penetration.
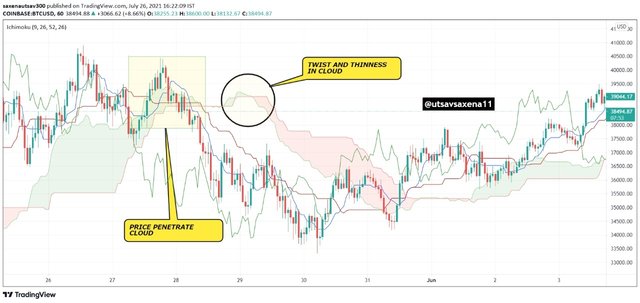
As you can see in the coinbase BTC USD chart of Varna timeframe there is a thinness in kumo cloud and because of that there is a twist and we can see a trend reversal. But because of illness in cloud there is penetration by the price in the cloud. And by this which we can clearly see market moving down after penetration. This thinness is showing weak resistance and support.
Resistance and Support By Komu cloud :
As we discussed above span line A and span line B working as strong resistance and support. So when tries enter in cloud area it will be respected by both senkou span line A and Senkou span line B. Both this line create support and resistance depending upon the market Trend. Sometimes span line A work as resistance and some time span line B work as resistance.
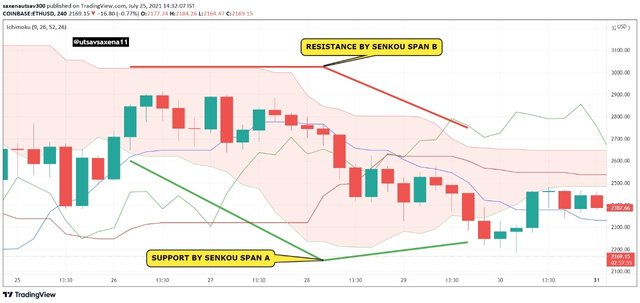
In the given coinbase ethereum USD chart we can clearly see when price enter in the market kumo cloud span line B working as a resistance and span line A working as support. Both these lines are strong enough to bounce back the price.
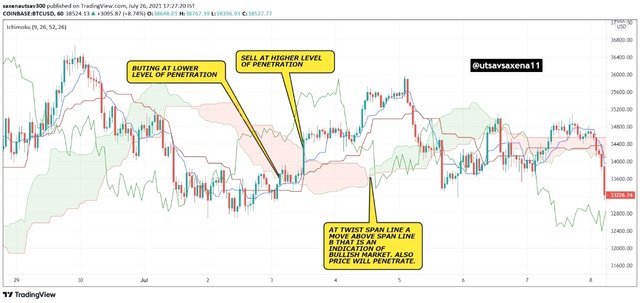
Difference between traditional resistance user and ichimoku resistance user
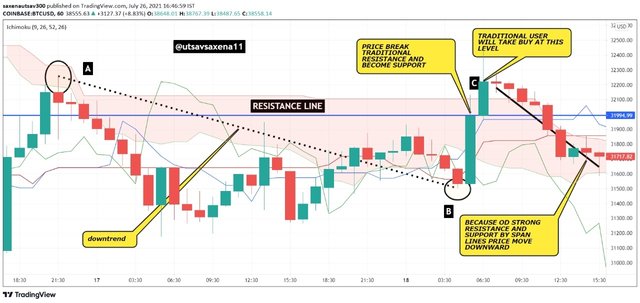
Let us take an example to understand what is the difference between the traditional resistance line and the ichimoku resistance line. In the above BTC USD coinbase 1 hour chart. At point A a downward trend start till point B. And in between there is a traditional resistance line that moving the price downward again and again. But soon after price break the traditional resistance line at point c. The traditional user will now consider the resistance line as the support line and will think to buy the Asset. But after buying they saw a down trend by the market. This down trend was created by strong resistance span line that a ichimoku indicator user know, and because of that ichimoku indicator user will not enter in such trade.
And this created difference in between the traditional user and ichimoku user.
This is how we can see the price movement with kumo cloud and create a resistance and support using span lines.
QUESTION 3:
How and why is the twist formed? And once we've "seen" the twist, how do we use it in our trading? (Screenshot required)
ANSWER 3:
Twist in Ichimoku komu cloud is formed when Senkou span line A cross Senkou span line B. This can create three different trends in the market. Uptrend, downtrend and Neutral market. When cloud become think or when Area between Span line A and span line B decrease then there is high probability of formation of twist.
Twsit and trend :
Uptrend :-
When Span line A cross Span line B and move above it then it is a signal of bullish market that is a uptrend market.
Downtrend :-
When Span line B cross Span line A and move above it then it is a signal of bearish market that is a downtrend market.
Neutral :-
When Span line B cross Span line A several times and move on same level that is flat level then it is a signal of neutral market.
Twist in trading :
During twist the cloud get thin that means the area between the two span lines decrease. This indicates that price will penetrate and break the cloud and may move upward or downward depending upon the situation. In the cloud the price will create a strong resistance and support by the two span lines. So the trader can use this opportunity by buying their asset at lower point and sell them at Higher point before the price take exit out from the cloud. Twist help trader to take small profits.
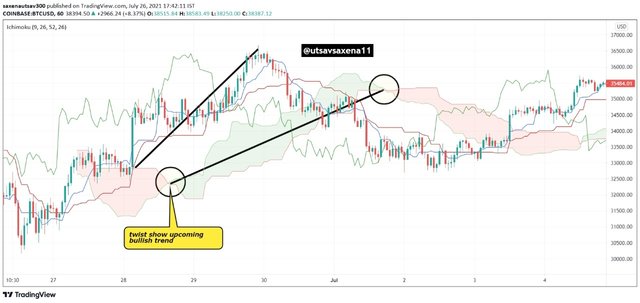
For example :-
In the above coinbase BTC USD 1 hour time frame chart we can see a twist where span line a move above span line b which indicates a bullish market. And because of this twist price will penetrate inside the cloud that we can see in the price so by taking strong support and resistance we can do to buying at lower level and selling at Higher level in the cloud only which will provide a small profit. If a trader want to take a large profit then they can buy at lower level and sell at the higher level before the second twist.
QUESTION 4:
What is the Ichimoku trend confirmation strategy with the cloud (Kumo)? And what are the signals that detect a trend reversal? (Screenshot required)
ANSWER 4:
There are are two strategies to confirm trend in the market using ichimoku indicator. While using ichimoku indicator we can confirm 3 trends bullish Trend, bearish trend, and neutral Trend. Every time the approach that span line A is above span line B is indication of bullish trend is not correct because of the existence of neutral Trend. This trend is a rear Trend but still have a probability to exist. So trend confirmation also depend on movement of cloud with the price action. Let us see the three Trends form in price chart using ichimoku indicator komu clouds.
Bullish trend :
The two main points to determine the bullish trend is is that the span line A is above span line B moving upward and the area in between these two lines forming a cloud it is also moving upward. Then it is said to be that a bullish trend exist in the market.
As you can see in the above ethereum USD for time frame chart senkou span line A is above senkou span line B and also cloud that is kumo cloud is moving upward so the market is in bullish phase. So one can enter in buy at lower point and sell at higher point.
Bearish trend :
The two main points to determine the bearish trend is is that the span line A is below span line B moving downward and the area in between these two lines forming a cloud it is also moving downward. Then it is said to be that a bearish trend exist in the market.
As you can see in the above BTC USD chart of 1 hour time frame that Senkou span line B is above Senkou span line A and also the cloud Area between two is moving downward. So this is a clear indication of downtrend in the market.
Neutral trend :
When senkou span A line and Senkou soan B line get flat and move ranging, some time A is above and sometimes B Is above then it is said to be neutral market. In this price penetrate the cloud several times and because of that it can't form strong support and resistance.
As you can see in the above btcusd 1 hour time frame chart the prices in the neutral Trend because flat span lines are form and in between the neutral trend many twist form and because of that thin cloud formation lead to penetrate the price in the cloud.
the signals that detect a trend reversal using inchimoku komu cloud are :
Twist :-
Whenever II the span lines cross each other they create a twist and it is possible that it will create a trend reversal in the market that means uptrend market will now move downtrend market or vice versa. But twist alone cannot decide trend reversal because it may also lead to neutral market or For resetting the price.
Price movement:
As as we discussed above that after twist price will move aur penetrate the cloud. The trader have to wait it after penetration whether the price break above or below the cloud to identify the trend. When price penetrate then it hold within strong resistance and support.
Cloud Direction :
Cloud direction must be in the same direction of the new trend to confirm the trend reversal with the span lines as per requirement.
Chikou span line :
Chikou span line must broke the cloud in the same direction of the trend. It is a lagging span line and used to determine trend reversal in the market.
Now let us take an example to check the trend reversal in the market.
For example :
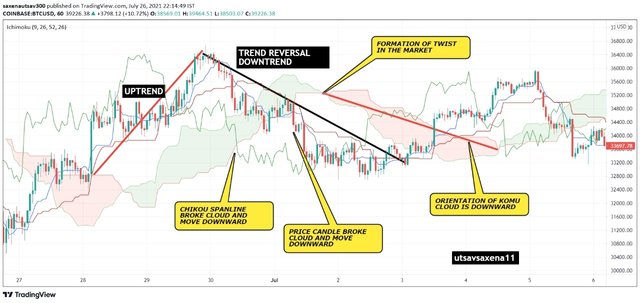
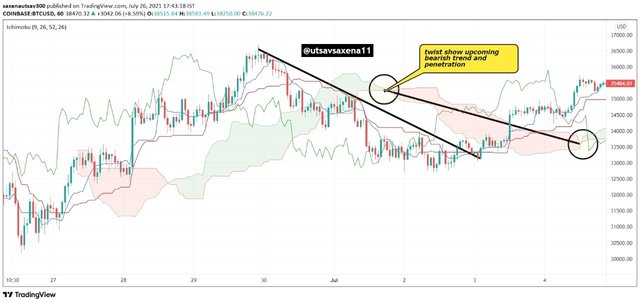
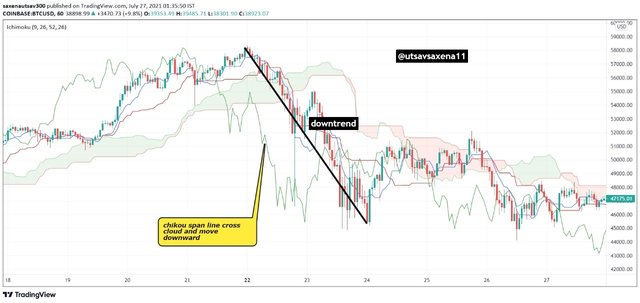
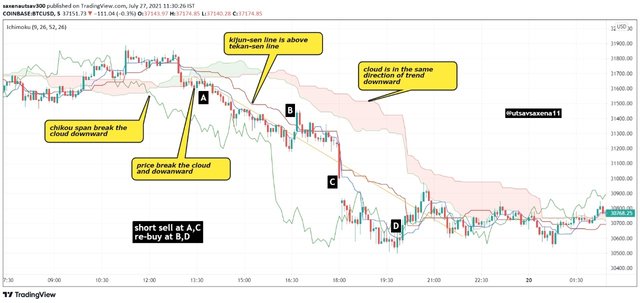
As you can see in the above Btc Usd 1 hour time. Frame chart that price in previous trend is upward and then show a trend reversal to downtrend which decided by four factors that are :
- Chikou span line break komu cloud and move downward.
- Komu cloud itself move downward when Senkou span B is above Snekou span A.
- Twist form after uptrend end by the komu cloud.
- Price break the komu cloud and move downward.
All these factors update us that it is a trend reversal and price change from uptrend to downtrend.
This is how we have to check trend and trend reversal in the market by ichimoku komu cloud and other indications.
QUESTION 5:
Explain the trading strategy using the cloud and the chikou span together. (Screenshot required)
ANSWER 5 :-
Chikou span line is a lagging line that move 26 period backward from current closing price. It help to detect trend reversal and also correct trend of buying and selling in the market with both ling term and short term trade. Kumo cloud and Chico span have a very unique combination as kumo cloud show future 26 period Trend and Chikou span show past lagging 26 period trend.
Chikou span uptrend :
When the Chikou span line in trending market cross kumo cloud and move upward above the price and the kumo cloud then it is considered to be the uptrend market also known as the bullish Trend.
In the above btcusd 1 hour time frame chart you can see that chikou span line is above the kumo cloud and the price which indicate the bullish market that we can see.
Chikou span downtrend :
When the Chikou span line in trending market cross kumo cloud and move downward below the price and the kumo cloud then it is considered to be the downtrend market also known as the bearish Trend.
In the above btcusd 1 hour time frame chart you can see that chikou span line is below the kumo cloud and the price which indicate the bearish market that we can see.
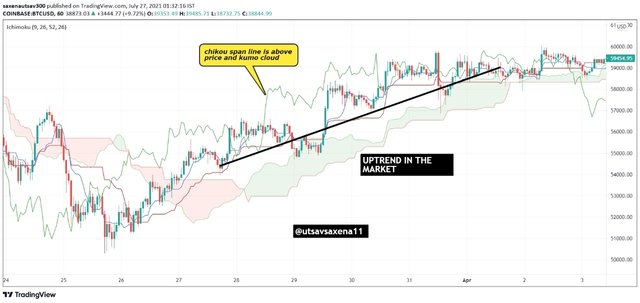
Taking Long position:
When the Chikou span line breaks the price and move upward and in the same breakpoint 26 candle of price is above the komu cloud then it is a clear indication of a strong bullish market. Also, the Chikou span line moves above komu cloud and price then take a long position in trade to get good profit.
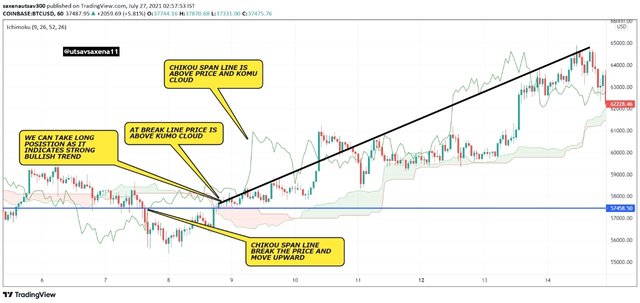
As you can see that blue line indicates the chikou span break the price and in the same level 26 period is above kumo cloud that is a clear and strong indication of strong bullish trend, so we can take a long position in BTCUSD 1 hour time frame chart. As you can see also that black line shows strong bullish long trend.
Taking Short position:
When the Chikou span line breaks the price and move downward and in the same breakpoint 26 candle of price is below the komu cloud then it is a clear indication of a strong bearish market. Also, the Chikou span line moves below the home cloud and the price then takes a short position in trade to get good profit. It means sell the asset and re-buy at lower price level.
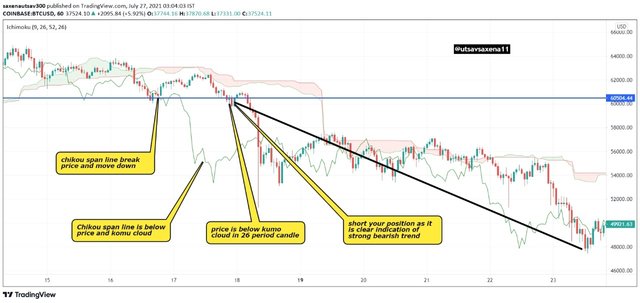
As you can see that blue line indicates the chikou span break the price and in the same level 26 period is below kumo cloud that is a clear and strong indication of strong bearish trend, so we can take a short position in BTCUSD 1 hour time frame chart. As you can see also that black line shows strong bearish long trend. So by short selling we can re buy again and make good profits.
This is how we can trade using Kumo cloud and chikou span line.
QUESTION 6:
Explain the use of the Ichimoku indicator for the scalping trading strategy. (Screenshot required)
ANSWER 6 :-
Scaling is the trading strategy that use small time frame like 5,10,15 mins to make small profits in market without huge losses. Ichimoku kinko Hyo indicator is very much useful in scalping because it can be use on any time frame as per requirement by trader.
The method will be same to detect the uptrend and downtrend in the market but in small time frame. So let us take a 5 mint time frame to understand this method.
Ichimoku uptrend indicator:
The method to confirm uptrend by ichimoku indicator is given below :
- Chikou span line break the cloud and move upward in the same direction of the kuno cloud.
- price candle break the cloud and move in the same direction. It means that price will move upward in same direction by breaking cloud as resistance.
- Tenkan-sen line is above Kijun-sen line. A perfect indication of bullish trend.
- Kumo cloud move in the same direction as price trend that is upward.
Let us see an example to make our understanding of uptrend more clear.
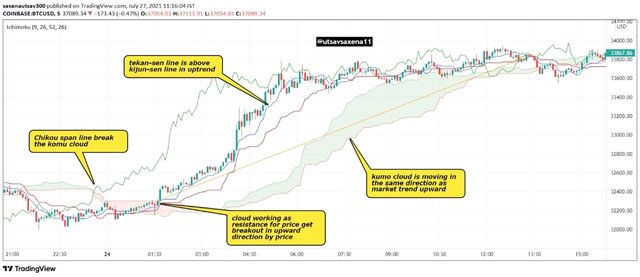
As you can see in the above coinbase btcusd 5 minut time frame chart that all the conditions of uptrend are satisfied and a trader can take small buy and small amount of sell with good profit in large volume of trades.
Ichimoku downtrend indicator:
The method to confirm downtrend by ichimoku indicator is given below :
- Chikou span line break the cloud and move downward in the same direction of the kuno cloud.
- price candle break the cloud and move in the same direction. It means that price will move downward in same direction by breaking cloud as support.
- Tenkan-sen line is below Kijun-sen line. A perfect indication of bearish trend.
- Kumo cloud move in the same direction as price trend that is downward.
Let us see an example to make our understanding of uptrend more clear.
As you can see in the above coinbase btcusd 5 minut time frame chart that all the conditions of downtrend are satisfied and a trader can take advantage by short sell and rebuy again to make good profit in large volume of trades. With the help to ichimoku indicator.
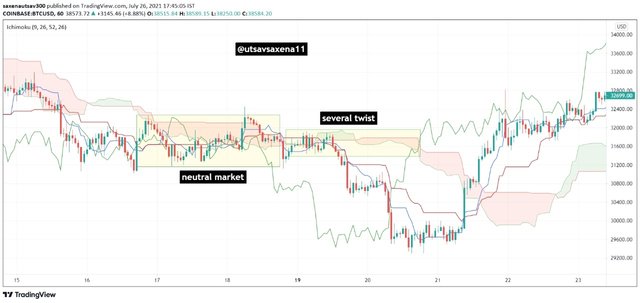
Inchmoku range (neutral market):
When there is large number of twist present in certain time period and all the indicator are moving together then it is a range market. But still we can apply scalp trading as one can get easy buy and sell points in range market also so by ichimoku indicator.
Let us take an example to make our idea of range market more clear.
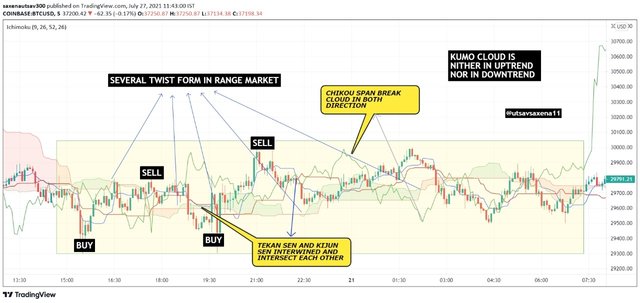
As we can see in the above btcusd 5 minute time frame chart we are getting a range market. We verify the range Market by several number of Twist chikou span line crossing kumo cloud in both directions, Tekan sen and kijun sen line intersect and inter wined each other and price move in sideways direction. So one can take buy at lower level and sell at higher level.
This is how we can perform scalping the small time frame and good profit strategy using ichimoku kinko hyo indicator.
Conclusion
Now it's time to conclude our homework post in which we discuss about ichimoku kinko hyo indicator most important part kumo cloud that is the area between two span line name as senkou soan A and Senkou span B.Both these lines are leading lines as show future 26 periods of the price trend. It is very much useful in making support and resistance, and also create an indication of the trend reversal. Cloud move up Trend in bullish market and downtrend in a bearish market. When the cloud moves up the Trend then senkou span line A is above B and vice versa. When there is a trend reversal in the market then a twisted form in a Kumo cloud. This twist is the first indication of a trend reversal in the market. But there are other factors also that ensure the trend reversal.
Chikou span lines the lagging line also show trend reversal when it breaks cloud and moves in the same direction of the trend. We can also use Ichimoku in the small trade time frame that help in scalping.For a long term position, one has to check the conditions of a strong bullish market. When chikou span line breaks cloud and moves upward than in the same level of 26 periods of price. The candle must be above the Kumo cloud. It is a strong indication of a strong bullish market. For short position, Chikou span breaks Kumo downward and 26-period future candle must be below Kumo cloud for a strong bearish trend.

Thankyou
Hello @utsavsaxena11,
Thank you for participating in the 5th Week Crypto Course in its third season and for your efforts to complete the suggested tasks, you deserve a 10/10 rating, according to the following scale:
My review :
An article with excellent content in which you have provided a set of useful information to answer the questions posed, and I will take some notes for you:
Very often when the cloud twists after a period of trend, prices enter a range (in 75% of cases). The twist indicates a weakening of the trend and in no way a change in trend to come. This information is given to us in advance giving the trader time to act and consider taking his profits. The trader can also prepare to trade the probable range to come. By watching the twist, we will know faster than others that the trend is likely to run out of steam and we will be ready to trade the range before everyone else.
For your information the preferred strategy of Scalping with the Ichimoku indicator is called "Scalping Ichimoku in one minute M1", but we all know that the supports and resistances identified in the higher time frames will have a greater impact on the price trends. This is why the analysis of Ichimoku M15 and M5 is essential.
Thanks again for your effort, and we look forward to reading your next work.
Sincerely,@kouba01
Thank you so much professor for your kind review...