Homework post for @cryptokraze || Sharkfin pattern|| utsavsaxena11
Hello steemians how are you? I hope you all are doing well and you all are safe and healthy during this pandemic time. Hope we all soon get the vaccine.
Today I go through one of the best and simplest language explanation homework posts by @cryptokraze on Sharkfin pattern in Trading. It's interesting to read the lecture post. Now I am Submitting my homework post to the professor.

HOMEWORK

QUESTION 1:
What do you understand by Sharkfin patterns. Explain by providing clear charts.
ANSWER 1:
When market is moving very fast in uptrend or downtrend, but quickly make a reverse in the market and move in opposite direction. During this reverse there is a formation of V shape structure by candles. This v shape is nothing but known as Sharkfin patter. There are two types of Sharkfin patterns form in the market. First one is normal V shape which means that when market move from downtrend to uptrend. Second one is Sharkfin pattern with inverted V shape which means that formation of Invert V when market move from uptrend to downtrend.
Sharkfin patterns are clear indication of potential trend reversal in the market. These trends reversals are short term reversals. Sometimes these are also traps to make a trader stuck in a trade so we have to aware of these traps too.
For example :
Normal V shape Sharkfin:
.png)
In the above BTCUSD chart of coinbase exchange in 1hour timeframe we can see on 27 July 2021 that market moving downtrend and soon create a swing low peak and move upward which create a V-shaped point known as normal V shape and this is a Sharkfin pattern.
Inverted V shape Sharkfin :
%20(1).png)
In the above BTCUSD chart of coinbase exchange in 1hour timeframe we can see on 12th July 2021 that market moving uptrend and soon create a swing high peak and move downward which create a inverted V-shaped point known as inverted V shape and this is a Sharkfin pattern. Similarly, on 13th July 2021 again a normal Sharkfin form V shape from down to uptrend.
This is how Sharkfin form in Chart patterns. This is the detailed analysis of Sharkfin pattern.
QUESTION 2:
Implement RSI indicator to spot Sharkfin patterns.(clear Chart needed).
ANSWER 2:
RSI indicator also known as Relative strength Index indicator is a indicator that use to make perfect entry and exit point in the market. Not only it tell us strength of the market but also analysis trend in the market.
As we discussed that sometime due to slow signals or false signals V shaped Sharkfin are become traps for a trader which make them to stuck in a trade. So to avoid such situations we need to Add an indicator which allow us to check Correct Sharkfin and that indicator is RSI.
How to apply RSI :

Click on fx indicator option and search RSI the first indicator generated is the origami default RSI indicator.
How RSI work :
Relative strength index consists of default values such as 14 period length 70 period over brought condition and 30 period oversold condition. Over brought condition tell us that the trade we buy has more value than buying and oversold tell us that at the price we sell the trade it is now very low to re-buy again. So by using Over-brought and over-sold setup we can check correct shark fin pattern.
Normal V shape with RSI :
When Normal V shape form then RSI indicator must be in over-sold condition. It means that RSI line must move below 30 and then recover and move above 30. This will create a Normal V shape trade in the market in both RSI and market chart pattern.
.png)
As you can see in the above BTCUSD chart of 1 hour timeframe there is a formation of downtrend in main Market. As we see the RSI indicator we can see that first RSI line move below 30 take a recovery and move above 30 which create a V shape in RSI and similar shape we get in main chart which show that this is a correct Sharkfin.
Inverted V shape Sharkfin with RSI :
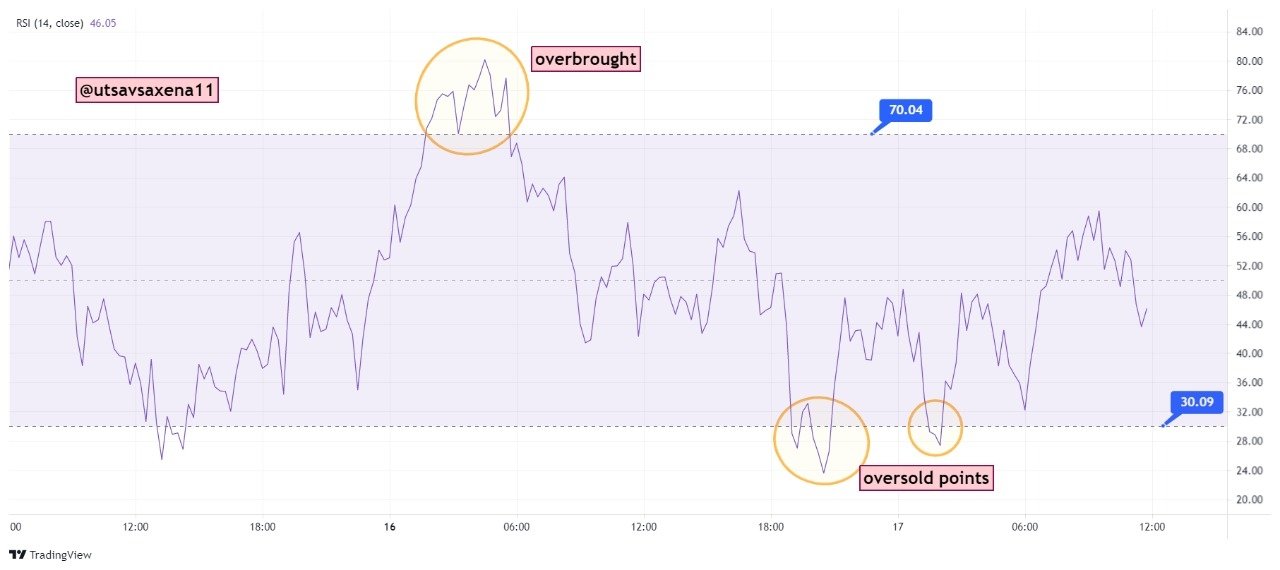
When Inverted V shape form then RSI indicator must be in Over-brought condition. It means that RSI line must move above 70 and then recover and move below 70. This will create a inverted V shape trade in the market in both RSI and market chart pattern.
.png)
As you can see in the above BTCUSD chart of 1 hour timeframe there is a formation of uptrend in main Market. As we see the RSI indicator we can see that first RSI line move above 70 take a recovery and move below 70 which create a inverted V shape in RSI and similar shape we get in main chart which show that this is a correct Sharkfin.
This is how we use relative strength index RSI to detect correct trend of Sharkfin in market to stay away from false signals and traps.
Question 3:
How to make entry and exit trade using Sharkfin patterns for trading. Give example.
Answer 3:
Let us try to explain Sharkfin patterns for trading strategy entry and exit in both buy and sell situations.
Entry in trade:
One can take entry in market in both situation that is for buy or for sell also. Let us both situation one by one.
Entry Trade for Buy position

To create a buy situation using Sharkfin, first, we have to take a normal Sharkfin pattern that means normal V shape and then we have to follow basic steps to find that buy point easily.
Create a normal V shape of your choice which means it is required to first market be in down trend and then move uptrend in both main chart and RSI indicator graph.
Now wait till the price in RSI indicator break oversold below 30 and move back above 30. This point is important.
When you see RSI line move just above 30 then you can take buy entry in the market at correct signal.
The main thing is we have to check always the main RSI line and the shark fin in correct order.
Now let us take an example to make our buy entry more clear.
For example:
.png)
From 24th to 25th May 2021, A situation is created in which we can see that price chart making Sharkfin pattern our now we check RSI line moving below 30 and then move back above 30 As it move above 30 we buy the trade. so take entry and buy our trade. So here by buy our BTCUSD trade some where above $32738.24 as our RSI line break at this level.
Entry Trade for Sell position
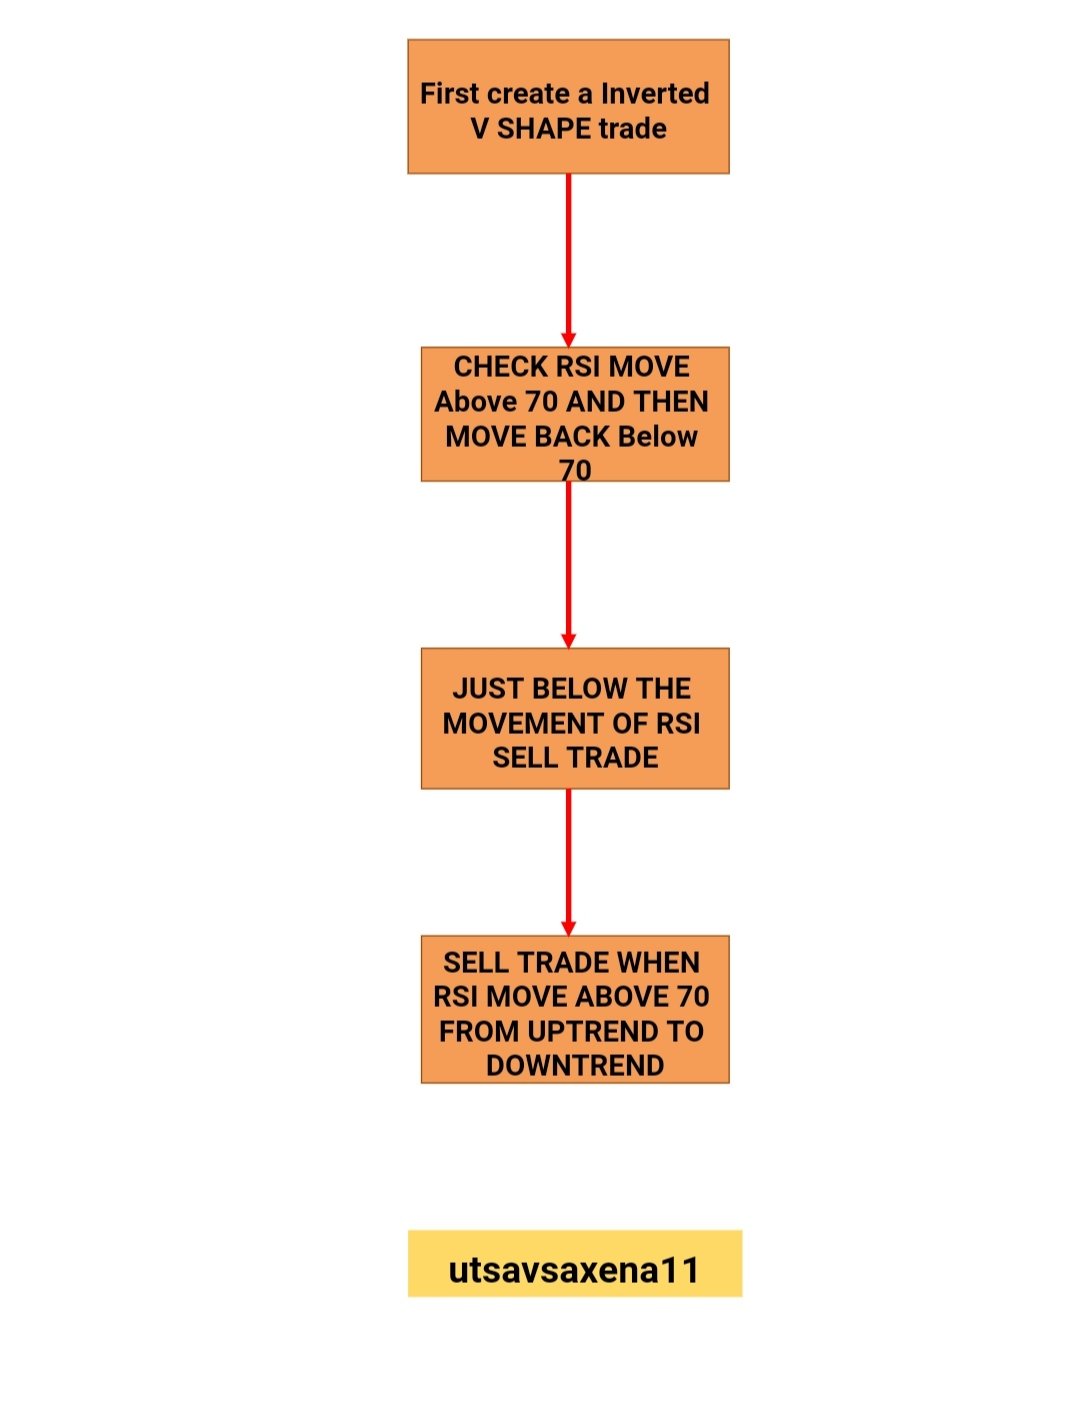
To create a sell situation using Sharkfin, first, we have to take an inverted Sharkfin pattern that means inverted V shape and then we have to follow basic steps to find that sell point easily.
Create a inverted V shape of your choice which means it is required to first market be in uptrend and then move downtrend in both main chart and RSI indicator graph.
Now wait till the price in RSI indicator break Over-brought and move above 70 and move back below 70. This point is important.
When you see RSI line move just below 70 then you can take sell entry in the market at correct signal.
The main thing is we have to check always the main RSI line and the shark fin in correct order.
Now let us take an example to make our sell entry more clear.
For example:
.png)
From 25th to 26th May 2021, A situation is created in which we can see that price chart making Sharkfin pattern our now we check RSI line moving above 70 and then move back below 70 As it move below 70 we sell the trade. so take entry and sell our trade. So here we sell our BTCUSD trade some where above $38,810.40 as our RSI line break at this level.
Exit from trade:
Exit from trade can only take place, whether you are in profit or in huge loss. To make perfect profit loss exit we use two levels
- stop loss
- take profit
Now let us see how to use these two in both buy and sell situation.
Exit Trade for Buy position

To exit from market during buy position of Sharkfin pattern trading we have to follow simple steps shown below.
After entry if our transaction/trading goes in wrong path then it is good to use stop loss to secure our trade from huge loss.
This stop loss level should be below the Sharkfin pattern point trade.
If price move towards stop loss or hit stop loss then our trade become weak and then we have to wait for next better trade condition form in Sharkfin trading.
To apply take profit one must use 1:1 risk:reward condition. It simply means that the point of take profit and stop loss should have a ratio of 1:1.
Put take profit above buy position anywhere in same ratio to that of stop loss. That is 1:1. When your price move and hit to take profit you can enjoy your trade and take exit out.
For example:
.png)
In same BTCUSD chart in between 24th-25th May 2021 we buy our trade but we have to secure ourself from loss. So we have to create a 1:1 Risk:Reward. In this chart we put stop loss just below Sharkfin pattern level and we put our take profit above buy trade both these stop loss and take profit are in the ratio 1:1. So if our price it stop loss our trade become invalid or if it hit take profit then it will become profitable to take exit from market.
Exit Trade for Sell position

To exit from market during sell position we have to follow simple steps shown below.
After entry if our transaction/trading goes in wrong path then it is good to use stop loss to secure our trade from huge loss.
This stop loss level should be above the sharkfin point trade.
If price move towards stop loss or hit stop loss then our trade become weak and then we have to wait for next better trade condition for better Sharkfin pattern.
To apply take profit one must use 1:1 risk:reward condition. It simply means that the point of take profit and stop loss should have a ratio of 1:1.
Put take profit below sell position anywhere in same ratio to that of stop loss. That is 1:1. When your price move and hit to take profit you can enjoy your trade and take exit out.
For example:
.png)
In same BTCUSD chart in between 25th-26th May 2021 we get a situation to sell our asset. But we have to secure ourself from loss and for that we have to use take profit and stop loss in the same ratio that is 1:1. So we apply stop loss above take Sharkfin pattern level and If your trade hit stop loss then trade become weak and we have to wait for next trade, so we can take exit otherwise if our trade hit take profit then you can enjoy profit and take exit from market. In thi situation hitting take profit means that be can re-buy our trade.
So these are the four methods to take entry in the market and exit from market. Its only the RSI indicator that help us to make perfect entry and exit point in the market and give us better results.
QUESTION 4:
Place two real/demo trades using Sharkfin pattern trading strategy.
ANSWER 4:
Let us establish two trades one in LTCUSD in 15 mins and BNBUSDT in 1 mins time frame for both take profit and stop loss to exit the Market.
In this we are taking buy or sell condition and will get depend on our stop loss and take profit.
Buy LTCUSD using Sharkfin pattern trading strategy: (hitting take profit)
So to buy an asset we have to check RSI indicator to make Downtrend below 30 and then move above 30. Just on the cross above 30 we have to buy our trade asset.

So, at night we take 15 mins timeframe of LTCUSD pair and wait for the market RSI to make a Trend in such a way that it will break Oversold line that 30 point and then move back above 30. Just above 30 we buy our asset as market and RSI both are showing same Trend. Buy asset @$181.09 by taking stop loss and take- profit in 1:1 method.

We put our take profit at $183.05 and stop loss at $179.33 that is in 1:1 risk: reward. After few hours our take profit hit the level and we make profit and take exit from the Market. As you can see in the above chart also that the market is created a Sharkfin pattern when we place the trade.
Buy BNBUSDT using Sharkfin pattern trading strategy: (hitting stop loss)
So to buy an asset we have to check RSI indicator to make Downtrend below 30 and then move above 30. Just on the cross above 30 we have to buy our trade asset.

So, in morning we take 1 mins timeframe of BNBUSDT pair and wait for the market RSI to make a Trend in such a way that it will break Oversold line that 30 point and then move back above 30. Just above 30 we buy our asset as market and RSI both are showing same Trend. Buy asset @$422.96 by taking stop loss and take- profit in 1:1 method.

We put our take profit at $424.0 and stop loss at $422.0 that is in 1:1 risk: reward. After few Mins our stop loss hit the level and we make loss and take exit from the Market. As you can see in the above chart also that the market did not created a Sharkfin pattern when we place the trade and make us loss trade.
Conclusion:
Now it is time to conclude our homework post in which we discuss about Sharkfin pattern trading strategy that is When market is moving very fast in uptrend or downtrend, but quickly make a reverse in the market and move in opposite direction. During this reverse there is a formation of V shape structure by candles. This v shape is nothing but known as Sharkfin patter. There are two types of Sharkfin patterns form in the market. These patterns are mostly form during reversals in the market. But because of some false signals and fake signals we have to be very much sure about its movement so to make it more accurate we use RSI indicator. When RSI move below 30 and then move above 30 just at cross we buy trade. And when RSI move above 70 and then move back below 70 then we sell trade. To take exit from Market we use stop loss and take profit to make our trade more valueable.
Finally we discussed two trades one for LTCUSD and another for BNBUSDT in both long and short time frame and in one trade we get success and in one trade we face loss. This is all about my homework post. Thankyou so much professor for such an informative and useful article.