Technical Indicators 2 - Crypto Academy / S4W4- Homework Post for @reminiscence01".

Now to the lectures proper.

Explain Leading and Lagging indicators in detail. Also, give examples of each of them.
Leading Indicators
Leading Indicators refers to the type of Indicator which gives the trader an early signal before the there is even a corresponding price action on the chat. And this type of Indicator is vital in trading though it has it disadvantage which I'll explain as I proceed.
I trader trading in a volatile market needs a lead Indicator in order to enter a trade early, but then such trader needs to be very careful so to avoid market manipulation by the whales traders trying to play with the market price so to favour them.
Now were I said the trader needs to be careful so not to fall for a Fakeout (price manipulation) is in the case of a Bullish trend and the Indicator which is a leading Indicator will show this early to the trader and then a market entry target is set, the early Uptrend that was indicated by the Indicator can immediately turn to a Downtrend and due to emotional factor the trader moves to exit the trade not knowing that it is a fake out so to continue in the previous Uptrend. In this case the trader might take profit just too early not to reap the full benefits of that particular trade entry.
Another senareo of disadvantage that might be encountered during the use of the leading Indicator, is tye mentality that in a very strong bullish run the trend is prone to reverse to the opposite (bearish) direction or trend, so with this trade knowledge a lead Indicator indicates a bull movement early and the trader enters the trade with the thought of having a downtrend, but then the market or trend can continue in the bullish run indicating a fake out to the trader.
So the leading Indicator which has a massive Advantage of showing the trader an intending trend before it occurs has a disadvantage of being played by the fake out or manipulation.
Example include; Average Directional Index (ADI), Stochastic Oscillator, Relative Strength Index etc.
Lagging Indicators
This refers to those Indicators that comes off after a price action has been taken already. So we can correctly say that they succeed the market price action. The lagging Indicators though late at market trend determination prevents the trader from fake out and false trend.
The lagging Indicators comes off after the trend has started action and this may cause a trader to enter a trade late and exiting early because of a quick trend reversal. This is the major disadvantage of the lagging Indicator. And this might cause the trader to miss out on some important trade signal thereby reducing his/her profit margin.
The lagging Indicator has an advantage of preventing the trader from entering into a false signaling trade unlike the leading Indicator that precedes the price action.
Example of the lagging Indicator include; Bollinger Band, Parabolic SAR, Bollinger Bands, Exponential Moving Average, etc.
With relevant screenshots from your chart, give a technical explanation of the market reaction on any of the examples given in question 1a. Do this for both leading and lagging indicators.
Leading Indicators graph
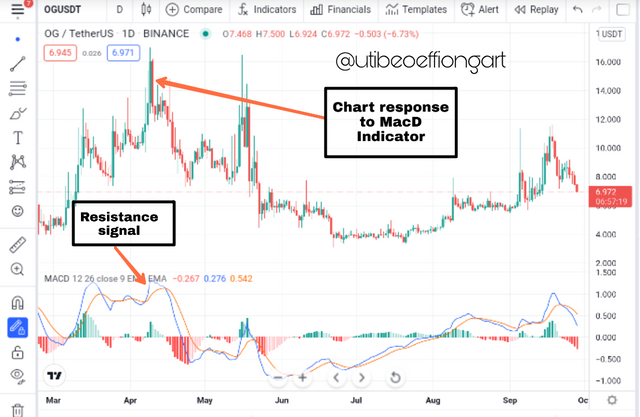
A daily OGUSDT chart showing the lead Indicator which is the MacD in this case. Where the Indicator quickly shows the trend reversal before the chart or market price correspondingly response to it.
Lagging Indicators graph
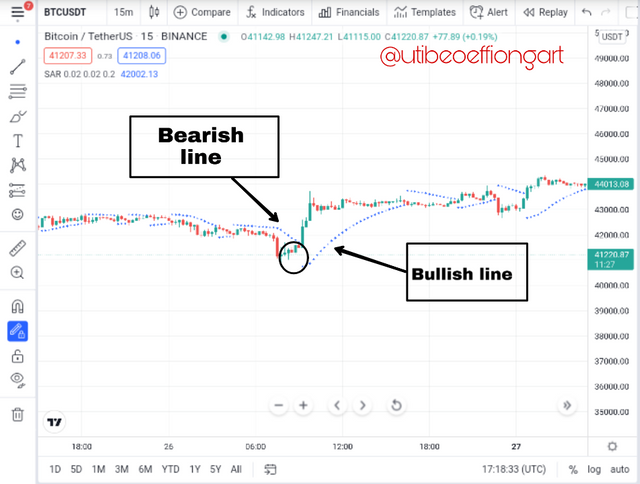
Using the Parabolic SAR Indicator on a BTCUSDT chart, the identified point on the chart shows the chart or market price making trend moves before the Indicator follows suit. Looking at the chart the bullish line started when the candles have 4 of the candles had made the Uptrend move and the Bearish came in to play at a 6 lagging point.
What are the factors to consider when using an indicator?
Just jumping on any indicator to use in a trade might be risky for a successful trading experience, therefore there are certain factors a trader should understand before proceeding to use an Indicator. They include;
Understand the Market trend.
One major method that will help is the technical analysis, were the trader will have to study the basic trends of such a market or crypto pair over some time frames in order to understand whether it is a trending market (i.e either Uptrend or Downtrend) or it is a ranging market.
Now a trending market which is majorly the up and down movement of the price or the resistance and Support movement of the market price needs a corresponding Indicator and which are Indicators like the RSI, MACD, Stochastic indicators etc. This type of Indicator is use because we are looking at crest levels that is the highs and lows. But then looking at the ranging market were the market price is in a continuous sideways movement, the aforementioned kind of Indicators can not be put to use. So over here we use Indicators such as the Bollinger Band, moving average etc.
Consider your Trading Style
This is another very important factor to consider while trading. Considering the swing trading and scalp trading styles.
Considering the swing trading styles were the trader banks on getting small and medium term profit over period of time like daily or weekly. So this kind of trader needs a corresponding Indicator such as the RSI, ADX etc.
Also looking at the scalp trading style where the trader makes use shorter time frame to take profit in-between, in this type of trading style the trade needs to pay much attention to trade signals so to avoid falling for wrong signals. So the Bollinger Bands, Ichimoku indicator and moving average will advisable.
Understand your chosen Indicator
Most trader jump on Indicators without a clear understanding of the workings and application of such Indicator on a trade. Without this understanding a trader can be mislead during a trading process. So I'll advise starter traders to go for simple Indicators to ease trading. Simple Indicators such as RSI, MA, MACD can be used easily but difficult one's like the Bollinger Band, Ichimoku indicator needs careful study before proceeding to usage.
Explain confluence in cryptocurrency trading. Pick a cryptocurrency pair of your choice and analyze the crypto pair using a confluence of any technical indicator and other technical analysis tools. (Screenshot of your chart is required ).
Confluence naturally means were two point meet. It is more like the agreeing point between two or more variables.
Heading to confluence in Cryptocurency, this can be described as an agreement between the market price and the Indicators in used by a trader. The confluence point is very vital in crypto trading in that a trader needs a confirmation before proceeding to enter into a trade, and the confluence levels gives this assurance to a trader in that the Indicators and the graph moves in a corresponding direction. The graphs below Explains this more;
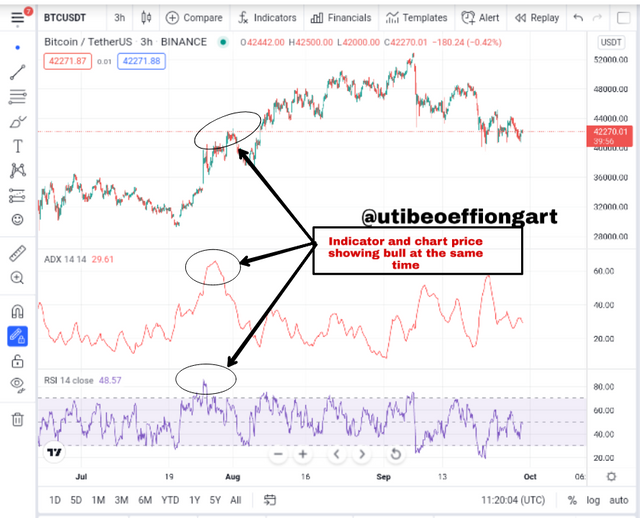
BTCUSDT chart in combination with Average Directional Index Indicator ADX and the RSI all correspondingly showing a bull which collocate with the crypto currency meaning of the confluence.
Explain how you can filter false signals from an indicator.
The explanation of how to filter out a false signal further explains the confluence levels in crypto currency. The use of one Indicator or even dependent on the Technical Analysis of a chart price without the use of an indicator or Indicators is very risky for a successful trading experience.
Therefore for a trader to be able to filter out a fake signal he/she has to input Indicators into the trade and not just inputing an indicator but using an indicator he or she is very much conversant with to avoid misinterpretation which might to wrong entry.
Another very important thing a trader should watch out for is Fakeout were a simingly resistance or Support Level immediately turns to a support or resistance level respectively thereby misleading the trader into a Fakeout trap. In this case a trader should be a careful studier of the market so to understand the market flow and then also understand how to set his/her stop loss to avoid complete losses in cases like this.
It is worthy of note to state that no Indicator or strategy is 100 percent so a trader should know how to set his/her stop loss and take profit to avoid complete loss during trading.
Explain your understanding of divergences and how they can help in making a good trading decision.
Divergences
The divergence signal is a complete opposite of the confluence signal earlier Explained in previous question. Divergence in Cryptocurency refers to the senereo were the market price is moving in an opposite direction to the signal shown by the technical Indicator. This case most of the time is often taken to be a false a signal which is not far from being the truth in that the market price and the Indicator should be correspondingly showing the same Directional movement for the trade not to be a fake out, but the divergence signal is not so.
But then some traders have taken Advantage of this divergence signal to correct the fake signal. This is simply done by the determination of the fact that immediately a chart and a signal shows a divergence move then a trend reversal is about to be experienced. But a trader still needs to be observant to avoid losses.
Using relevant screenshots and an indicator of your choice, explain bullish and bearish divergences on any cryptocurrency pair.
Bullish divergence
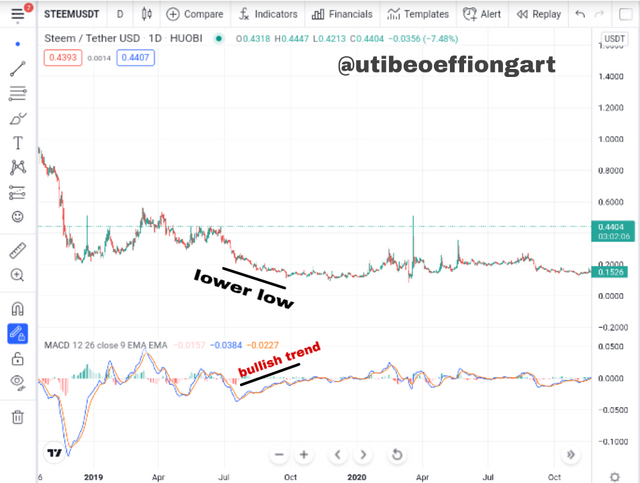
The bullish divergence occurs when the Indicator is signaling an Uptrend by the formation of higher highs and then the corresponding point on the market price or chart shows a downtrend of lower lows. Which is represented in the STEEMUSDT chart above.
Bearish Divergence
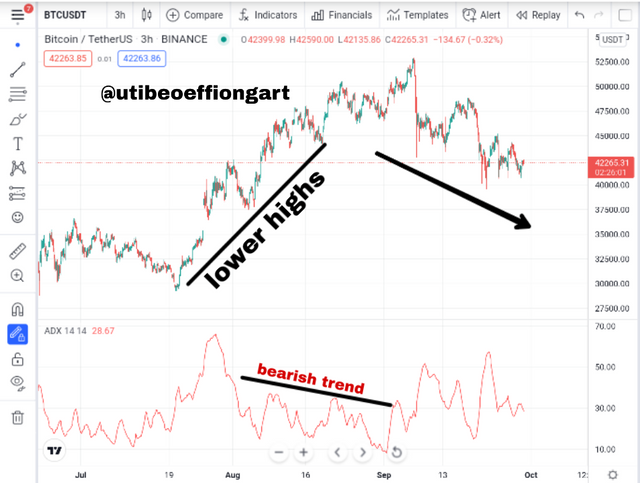
The bearish divergence occurs when the Indicator signals shows a downtrend of lower lows and the corresponding chart shows higher highs as represented in the chart above.
It is worthy of note for traders that at the end of divergence signal is always a reversal trend. Though an indicator still needs to be used for more confirmation.
Conclusion
The use of Indicators is very vital during a trade process in order to minimize the risk involved in trading. In as much as the use of Indicators ease trading and minimize loss, it is worthy of note that no Indicator is 100 percent therefore a trader should understand his/her trading style, technique, Indicator to avoid loss and very importantly the use of stop loss.
Thank you.
Hello @utibeoeffiongart, I’m glad you participated in the 4th week Season 4 of the Beginner’s class at the Steemit Crypto Academy. Your grades in this task are as follows:
Recommendation / Feedback:
Thank you for participating in this homework task.