Support and Resistance Breakouts - Crypto Academy / S6W3 - Homework post for pelon53.

image created by me on picsart
Again this week, as usual I will be expressing my knowledge on this lesson through the home work question.

Explain in detail the advantages of locating support and resistance on a chart before trading.
To perform this task we will be looking at the advantage of locating support and resistance in a chart.
Identifying support and resistance on a chart before trading is one important aspect traders engage in while wanting to trade, because it increases the probability of making profit and reducing losses.
Below are the advantages of locating support and resistance on a chart before trading.
For Identifying trend and making trading decision:-
Locating Support and resistance before trading are good strategies in terms of understanding the price movement which helps in making good trading decisions.
For example, assuming a trader notice that an asset price hit a support level that's when a good opportunity to buy an asset pops up because the asset might rebound and rise higher. Same as resistance, when it hits the resistance it serves as a good opportunity to sell.
For identifying price point:- locating support and resistance on a chart helps in spotting out price point.
During technical analysis, trader uses this support and resistance to identify price point on a price chart where the market favours a pause in trend or a reversal( price moving in an opposite direction)of a strong trend.
Locating support and resistance can help in choosing the best strategic entry and exist position:-Before trading some traders or technical analyst uses support and resistance level to determine their entry and exit point owing to the fact that this support and resistance area normally represent the asset price that has more power to change the asset direction.
In other words, the resistance and support level helps in determining the best entry and exit position in the market.
Explain in your own words the breakout of support and resistance, show screenshots for the breakout of a resistance, use another indicator as a filter.
Firstly, to define the breakout in support and resistance, let first understand what a breakout in trading as a whole means.
Breakout as the word implies is when an asset price moves outside(breakout) an identified or defined support and resistance level with an increasing volume. By this breakout traders tends to enter a long trading position after a breakout above the resistance as while as entering a short position after the price breakout below support.
Resistance breakout simple occur when an asset moves in a range bouncing off and on the resistance and support level then finally break through the upper level which is the resistance level and goes above it, that makes it a resistance breakout.
Support breakout simple occur when an asset that moves in a range bouncing off and on the resistance and support level then finally break through the lower level which is the support level and goes below it, that makes it a support breakout.
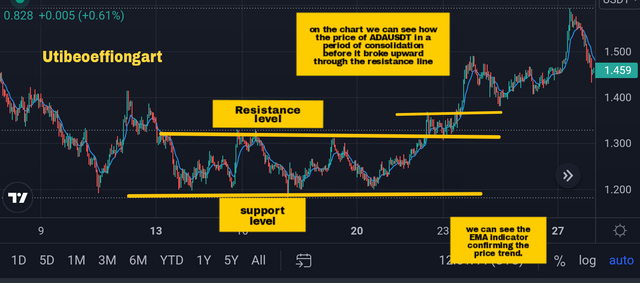
The chart above is an ADAUDST chart couple with an EMA indicator, looking closely to the chart we can observe there was a breakout of the resistance where after the price range(consolidation) the was a breakthrough the resistance zone to the upside signifying a breakout resistance, where the price breaks the resistance and return to the resistance line which is now it new support then continue going higher and also we can see the EMA indicator line moving below the price confirming the breakout to an uptrend by moving below the price.
Show and explain support breakout, use additional indicator as filter, show screenshots.
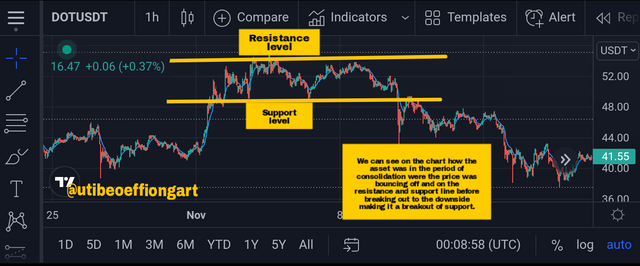
The chart above is a DOTUSDT chart couple with an EMA indicator, if we look closely into the chart we will see the breakout of the support where after a period of consolidation(price range) the was a breakout through the support zone in a downward direction, we can also see the price break the support and return to the support which turn resistance and then the price continue in a downward trend.
To filter the breakout signal, I used the EMA indicator. We can see how the EMA indicator was trending above the price therefore confirming the breakout to a downtrend.
Explain what a false breakout is and how to avoid trading at that time. Show screenshots.
False breakout talks about a situation where a price moves through a located level of support or resistance but it doesn't have enough momentum to keep going in that direction so therefore causing a reversal or retreat to an opposite direction. This causes traders who trades on breakout strategy to close trade when this false breakout occur or better still enter trade in the opposite direction of the attempted breakout.
False breakout might be worst for breakout traders who enters position immediately as the price breaks.
This generally, interpret that the was no enough buying interest to keep pulling the price above resistance and support.
False breakout can't be evicted in the trading market the solution to it is to avoid trading at the particular time it occur.
For a trader to avoid trading at that particular time he/she needs to wait for the formation of the candle which broke the support and resistance. When the traders see that the resistance and support has been broken, the traders has to wait for the price to return to the area where it broke previously.
Then the trader can enter the market when the next bullish or bearish candlestick are form respectively after the pull back.
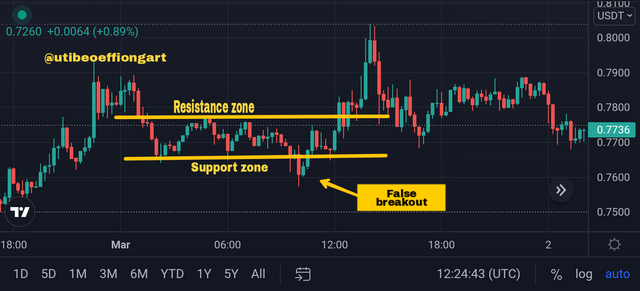
The XRPUSDT chart above signifys a false breakout, we can see the price broke the support zone and later reverse to the upside where it brokes the zone again and then reverse to touch the support zone from there it gains momentum and started going up till it breaks the resistance.
All this illustrate a false breakout.
On a demo account, execute a trade when there is a resistance breakout, do your analysis. Screenshots are required
To perform this task, I will be placing a trade when there is a resistance breakout.
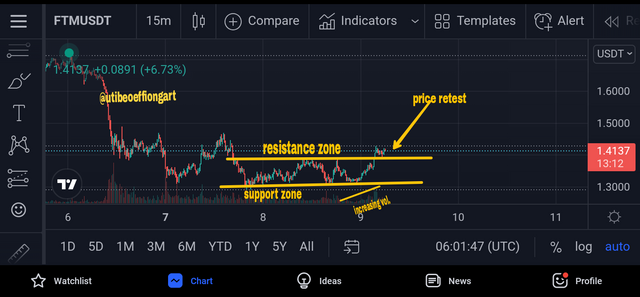
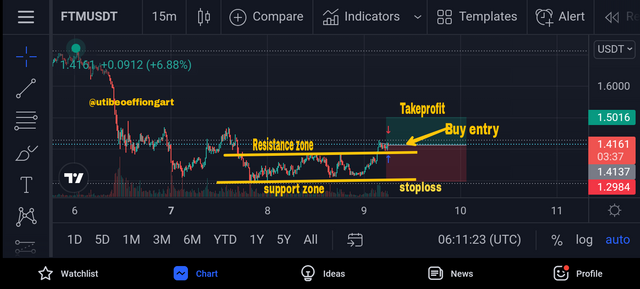
On the FTMUSDT chart with 15min timeframe above, we can see the price going in a range before the was a break of resistance.
We can see the price bouncing off and on the resistance and support before finally breaking the resistance zone, then after the break the price came back to retest the resistance which now serves as a support from here I could place my buy trade.
But before placing my trade it is very important to filter the signal of the break of resistance before proceeding in talking the trade.
To filter my signal I use the volume indicator which signal an increasing volume Verifying the break of resistance as seen on the chart above.
From here I place my buying trade after the 2nd candle was form, immediately after the retest as seen below on the chart with a Take profit at 1.5016 and stoploss at 1.2984.
After placing my trade it was executed, here is the screenshot of the result of my trade.
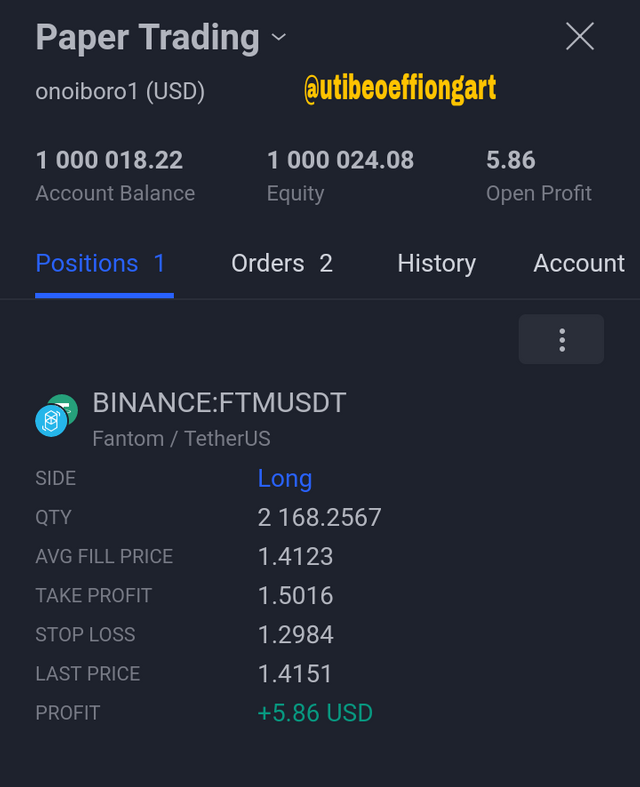
image screenshotted from tradingview.
In a demo account, execute a trade when there is a support break, do your analysis. Screenshots are required.
Here I will be using the break of support strategy to execute a sell trade.
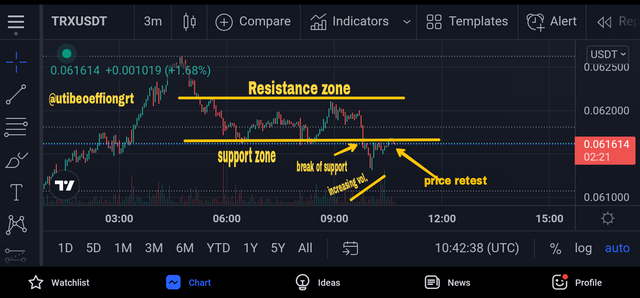
The chart above is a TRXUSDT chart with a 3min timeframe, as we can see on the chart how the price is in a range where we see it bouncing off and on the resistance and support zone before breaking off the support zone and then still returns to the support which turns a new resistance.
This scenario explain a situation were buyer and sellers action are dragging the price to the resistance and support zone before the sellers finally dominate the market and therefore dragging the price downward to break the support .
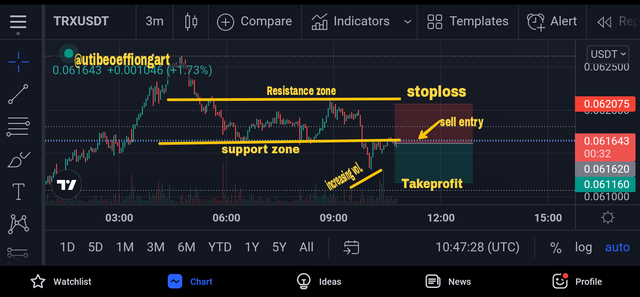
Here a trader can place a sell trade.
But before placing a trade it is very important to filter the signal of the break of support with an indicator before proceeding in talking the trade.
To filter my signal I use the volume indicator which signal an increasing volume Verifying the break of support as seen on the chart above.
From here I place my sell trade after some few candle were form immediately after the retest as seen below on the chart with a Take profit at 0.06116 and stoploss at 0.062075 where I set above the broken support.
After placing my trade it was executed, here is the screenshot of the result of my trade.
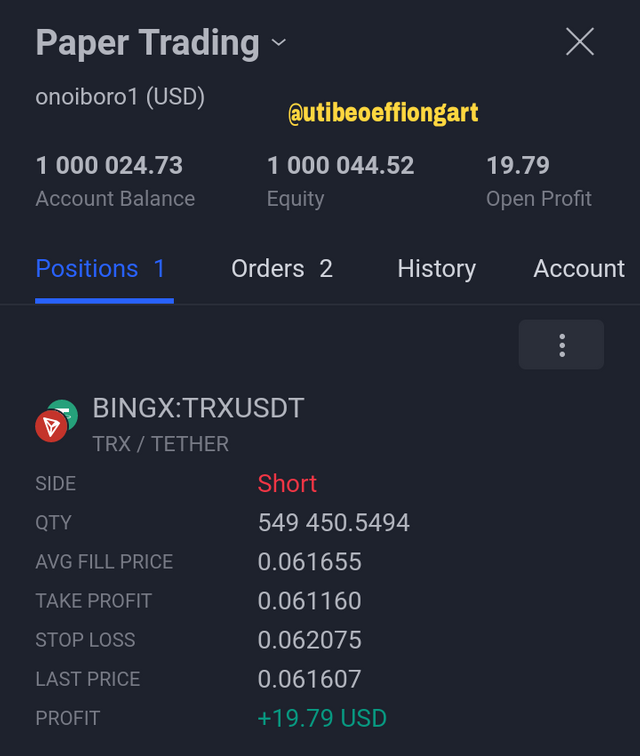
image screenshotted from tradingview.
Like I said before,Breakout as the word implies is when an asset price moves outside(breakout) an identified or defined support and resistance level with an increasing volume, buy this breakout traders tends to enter a long trading position after a breakout above the resistance as while as entering a short position after the price breaks below the support zone. Identifying this support and resistance on a chart before trading, is one important aspect traders engage in cause it increases the probability of making profit and reducing losses.
Indeed this has been an amazing topic, thanks to prof. @pelon53, through the lesson have been able to understand and explain the advantage of locating support and resistance, understanding breakout of support and resistance and how to combine this breakout with indicator to filter the signal and finally I executed a trade through this resistance and support breakout.
Once again thank you prof. @pelon for putting up an amazing lesson.
