Crypto Trading with Moving Average ]-Steemit Crypto Academy | S6W2 | Homework Post for @shemul21

Image created by me on picsart

Explain Your Understanding of Moving Average
Crypto currency we know are very volatile in nature, this makes the market very speculative or we say risky in nature, using a technical indicator during this trading analysis helps cope and survive in the volatile market like the cryptocurrency. One indicator mostly engage by the technical traders to reduce this risk is the moving average indicators with are designed to spot out effect of price volatility.
Compare to other indicators, moving average serve as one of the most popular used indicator to spot out the trend direction. There are always graphically appears as a line on the price chat showing the average of period set of price data and trend with extreme price movement.
Moving average simply give a clear and better idea of what direction the market price of an asset is going and where it might definitely go all this is done with smooth fluctuations.
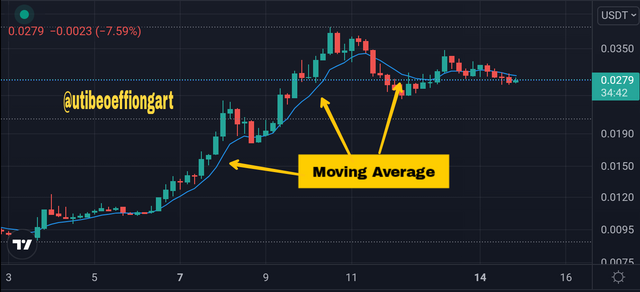
Moving average indicator on chartTradingview
Moving average indicator interpret the market trend to the trader in some simple logistics which say if the moving average is moving upward it suggest that an asset is in an uptrend and also if it moves downward means it in a downtrend(bearish trend) and also if a short term cross above the long term moving average it interpret a bullish trend.
If the price of an asset is above 50days moving average it interpret that buyers are dominating the market and if it below 50day it interpret a scenario were the sellers dominate the market.
Conclusion, a moving average is an indicator which spot trend reversal and provide trading signal trading to trader.
What Are The Different Types of Moving Average? Differentiate Between Them.
The moving average are of different types although all of them are classified into the moving average but the have differences base on the parameter and data point which are taken into consideration when there are calculated.
Below are there 3 types of effective moving average in the crypto market.
- Simple moving average
- Exponential moving average
- Weighted moving average
This is regarded as the simplest form of moving average. It is always calculated by taking the average price of a given data set over a particular period of time.
Simple moving average are always plotted dynamically as price fluatuates, in SMA, prices are always considered equally, which helps the traders to determine the true average price. As learnt SMA indicator shifts its position when a new candle forms.
Like i said previously, the SMA are always calculated by adding a set of price or number and then dividing by the number of price in the set.
The SMA are simply calculated using the formula below.
SMA = A1+ A2 + ----- + An / n
Where A represent the average in a period
And n represent a number of time period.
This is a type of moving average that gives more weight to the recent asset price point and makes it more responsive to recent data price as it gives same weight to all price changes in a given period. It help best in given accurate price prediction in a price reversal and price fluctuation though it is complex in calculation.
It is most useful for short term traders because there help them get recent price information in the crypto market.
It is always advisable to combine the SMA and EMA indicator to find both the short and long term price direction and price information.
EMA can be calculated by the formula below
EMA =[vt ×(s/1+d)] + EMAy × [1- (s/1+d)]
Where EMAt stand for EMA today
Vt stand for value today
EMAy stand for EMA yesterday
S stands for smoothing
d stand for number of days
This another wonderful type of moving average which helps traders in generating trade direction and also making buy and sell decision.
It is regarded as a moving average which gives much weight to the recent data point and less weightage past data point. in other words, the data information of a current price for is important than the previous day price.
It is mostly used by short term traders cause it ability to react faster to little price change in the crypto market.
WMA can be calculated by the formula below
WMA = (price × n + price 2 × (n-1) + price n)/[n ×(n-1)/2]
Where n stands for number of days
| SMA. | EMA. | WMA |
|---|---|---|
| SMA price lag behind | EMA act quickly to price change | WMA is more response to little price. |
| SMA with high value are always more reliable | EMA with low value are consider more reliable | WMA with high and lower value are both reliable. |
| SMA represent an average price of a crypto asset over a specific period of time. | The EMA takes into consideration the current price of an asset and the multiplier of smoothing | The WMA consider the most recent price data point with less consideration to the previous data point. |
| SMA is advisable for long term trading | EMA is advisable for short term trading and price reversal. | while WMA depends on recent data for price signal. |
Identify Entry and Exit Points Using Moving Average. (Demonstrate with Screenshots)
Like I said previously, Moving average play an important role in the market by using it signal to find any better available position in the market, most trader uses the moving average to help determine trend and also use to gauge market trends in order to rise their chances of success and take entry or exist trades in the direction of the market.
To accomplish this task I will simply idenfying the exits and the entering point using the two moving average call the EMA and the SMA.
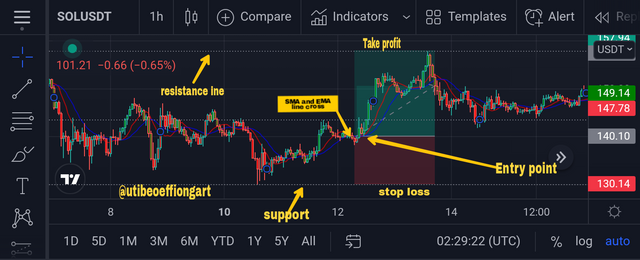
To identify a buy order using the moving average indicator I used a SOLUUSDT crypto pair , looking closing to the chart above,you will notice two indicators line which are the EMA and the SMA line. To identify an entry order, I took my entering order were the SMA and the EMA line crosses, this is regarded as one of the best strategy in placing a buy order. After that I place my risk management tool which is the stop loss and the take profit at the support line and the resistance line respectively.
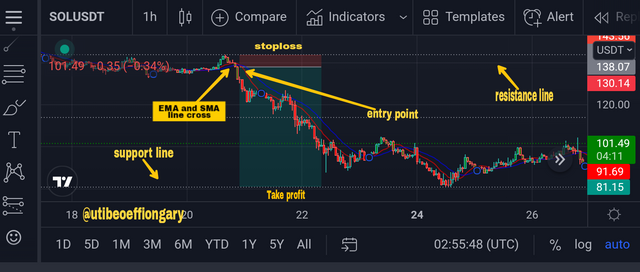
To identify a sell order using the moving average indicator I used a SOLUUSDT crypto pair , looking closing to the chart above you will notice two indicators line which are the EMA and the SMA line. To identify an entry order, I took my entering order were the SMA and the EMA line crosses, this is regarded as one of the best strategy in placing a sell order using moving average indicator . After that I place my risk management tool which is the stop loss and the take profit at the resistance line and the support line respectively.
What do you understand by Crossover? Explain in Your Own Words.
A moving average cross over is a strategy where trader uses to signal that strong movement in price is about to come as the momentum shift to one side.
The moving average crossover occur when the two moving average line cross through it itself. In other words, when a short term average cross through a long term average as show on the chart below.
The moving average crossover generate a strong trading signal to trader and also indicate changes in support/resistance level not withstanding holding period.
In a chart the bearish signal or sell signal approaches when a short term average cross through a long term average while a bullish signal or buy signal approaches when the short term average crossover a long term average in an upward structure all this implies to the chart below.
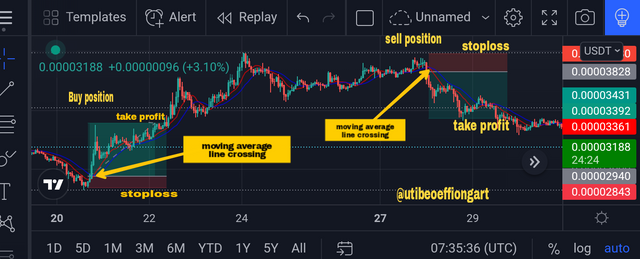
From the chart above, we can see the long term average and short term line crossing , the crossing signals a trend reversal from the bullish to bearish,where I placed a buy position in the first cross over and sell position on the second cross over.
Explain The Limitations of Moving Average.
Just as other moving average as their demerit,moving average is not an exception has it also has it short coming.
Below are the limitations of moving average.
Large number of data records are utilize by moving average method, from the past which is not of any use as the moving averages only present the current data.
It requires keeping history of different time period for each forecasted period.
Moving average doesn't consider data that are outside the average period.
when new data are added the average value and predicted value both changes.
The trend that are always given by moving average are straight line or standard curve, this makes the moving average lag behind because the trend value cannot be extended to forecast future value.
moving average is one important indicator a traders uses during technical analysis to spot trend reversal and provide trading signal for a better entry and exit position,it also gives a clear and better idea of what direction the market price of an asset is going and where it might definitely.
Thanks prof.@shemul21 for the wonderful and interesting lectures you, through your lectures have been able to learn vividly the content of moving average where I was able to explain it and also I was able to state it type with details.
Finally, I able to identify entry and exit point with a moving average indicator through crossover strategy, all this was possible through the wonderful lecture you put us through.
Once again thank you prof. @shemul21 looking forward to your next lecture.
