Crypto Trading with ATR Indicator - Crypto Academy S5/W1 - Homework Post for Professor @kouba01

Now to the assignment proper.

Discuss your understanding of the ATR indicator and how it is calculated? Give a clear example of calculation
ATR INDICATOR
An Indicator is one of the vital part of a trading pair analysis. An Indicator when properly used has the ability of preventing a trader from experiencing a bad trade turn out. Though Indicators are not always 100 percent but to some great extent could be of help.
Now most Indicators has the ability of helping the traders identify trend flow, buy and sell point, trend strength etc. But then we have the ATR Indicator that measures the volatility of the market price at a particular timeframe. The ATR Indicator not only helps in volatility measurements, but also aids traders to set their trade entry and exit positions easily and successfully. This is a suitable trade-risk management strategy were traders can use to prevent unnecessary losses.
The ATR Indicator meaning Average True Range is simply a volatility based Indicator, seeking to help traders sort out high and low volatility tides during trading i.e the buy and sell processes. The ATR Indicator takes into consideration the pairs movement at a particular time frame be it Per minute, or Per hour or Per day, all depending on the traders time frame specification.
How it is calculated
Now it is very important to understand the calculation of the ATR Indicator for more in-depth utilization. Now calculating the ATR Indicator, True Range is taken into consideration and this is done using three variable equations, which are;
- The difference between the Current High and the Current Low.
I.e. TR1 = Current High - Current low
- The difference between the Current High and the Previous Close
I.e. TR2 = Current Low - Previous Close
- The difference between the Current low and the Previous close
I.e. TR3 = Current Low - Previous close
From the formula above, we calculate out the following variables and divide the answer by 14. Now the answer gotten here will serve as the first ATR value. Now this is calculated thus.
ATR = [Maximum(TR1), Absolute(TR2), Absolute (TR3)]/14
With the formula above we can calculate the Previous ATR over the previous 14 period.
Now after finding the ATR over the past 14 periods then we proceed to finding the Current ATR and the formula to be used is thus;
ATR = (Previous ATR × (n - 1) + TR) / n
Now if after calculating the Previous ATR,
- Previous ATR was 6.5
- Then Maximum True Range was then 4.5
- n = number of periods.
Therefore,
Current ATR = (6.5 × (14-1) + 4.5)/14
Current ATR = (6.5 × 13 + 4.5)/14
Current ATR = 89/14
Current ATR = 6.4
From the solution the Current ATR shows low Volatility because of the reduction in the ATR value from the previous.
What do you think is the best setting of the ATR indicator period?
The best ATR Indicator Period Setting
Now it is very important to understand that setting of periods on any indicator is totally based on the type of trader carrying out the trade. And we have the Swing Traders and the Scalp traders.
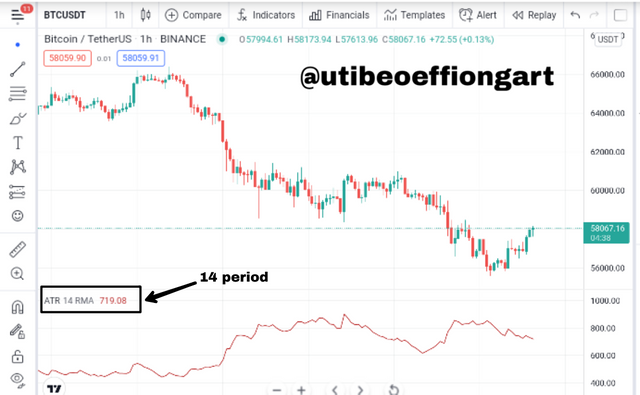
Default Period Setting
Now the ATR Indicator is set to a default of 14 period and the with this kind of average value the Indicator line is semi smooth and semi busy or unsmooth as seen below.
Screenshot from trading view
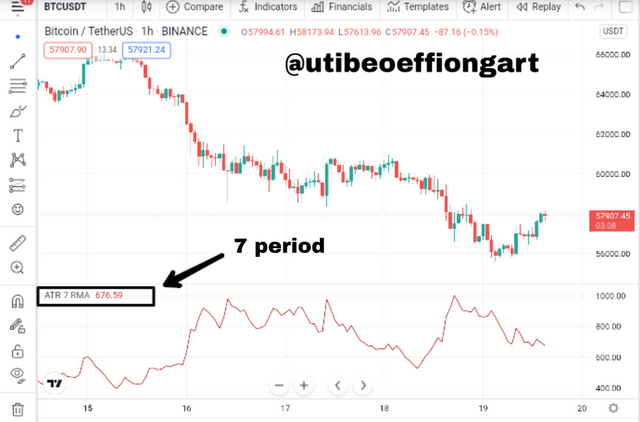
Scalp Traders Period setting
Screenshot from trading view
A Scalp trader who is a also a short term type of trader or called a day trader utilizes a short time frame during his/her trading expedition, such a trader will need a short Indicator period setting which is a more sensitive period and react to every details on the main chart.
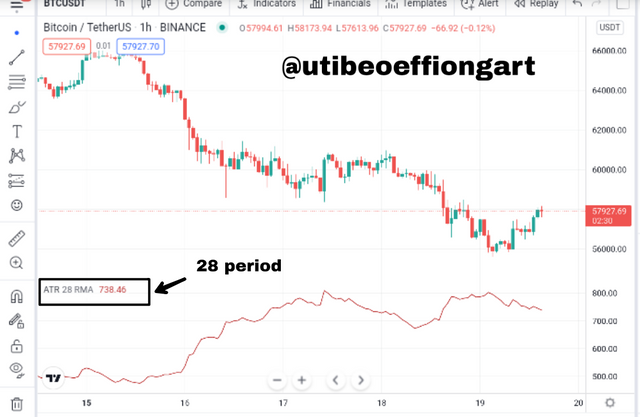
Swing Traders Period Setting
Screenshot from trading view
Now a Swing trader who is naturally a long term or long time frame trader will also utilize a long period setting for his trading expedition since it gives a more smoother Indicator line not reacting to every details occuring in the market chart.
Therefore the setting of the ATR Indicator is totally dependent on the type of trader I am.
How to read the ATR indicator? And is it better to read it alone or with other tools? If so, show the importance. (Screenshot required)
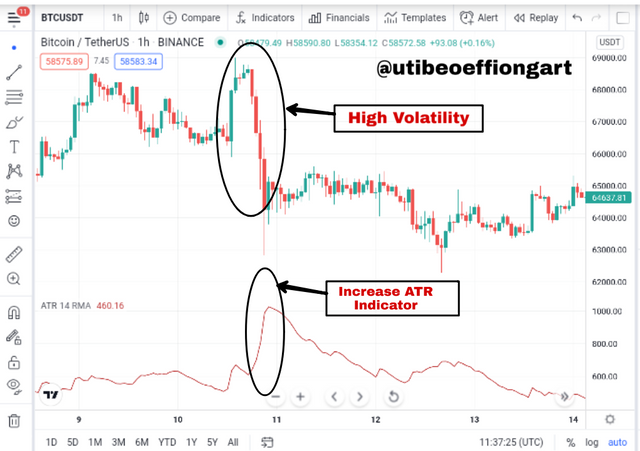
Reading the ATR Indicator without other tools
Screenshot from tradingview
Now it is great to know that the reading of the ATR Indicator on the chart is very easy. Since we are considering volatility rate of the asset. Now looking at the BTCUSDT pair above at a point on the chart the price experienced an uprise which shows an increase volatility and apparently the ATR Indicator showed same in conjunction. Therefore as the ATR Indicator increases the chart increases likewise showing a correct response of the ATR Indicator to the chart.
Screenshot from tradingview
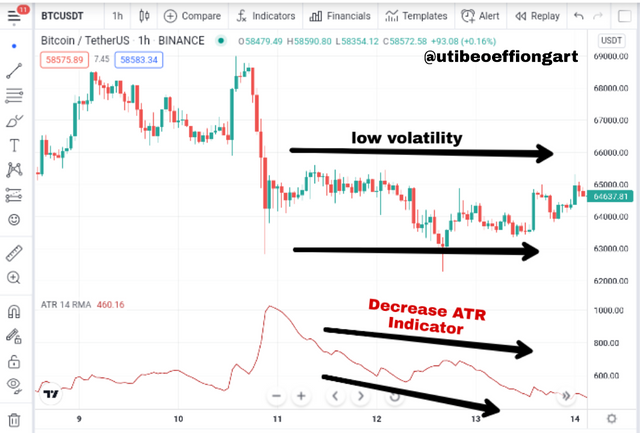
Now the above chart screenshot shows a decrease in Volatility of the price asset. Now immediately after the volatility increase there was a reverse and the price started experiencing a downturn telling us that the price is experiencing a low volatility rate. Now to be sure of that we look at the ATR Indicator and it also responded in same direction as price asset showing a correct reading which should give a trader a trading direction.
Reading the ATR Indicator with other tools
Screenshot from trading view
Now Prof. @kouba01 used Parabolic Indicator and classified it as the best Indicator to be used in combination with this ATR Indicator. But here I'll be using the Williams% Indicator to combine with the ATR.
It is no news to traders that to obtain Maximum results we have to combine our chart with two or technical analytical tools. Vis-a-vis the combination we are undertaking thus.
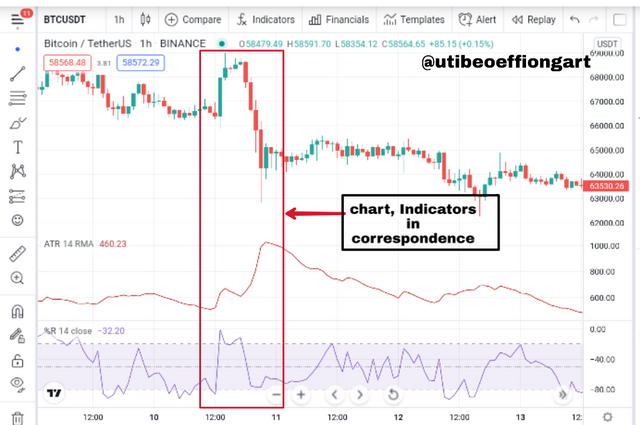
Now applying the % William to the already available Indicator being the ATR Indicator, looking at the BTCUSDT Indicator afore, we can see the agreement of the two Indicators showing high volatility. Though the %william Indicator is not a volatility based Indicator but more of a trend related Indicator but then when it in use with other Indicator it is of tremendous help.
Now the above chart shows a response of the three Indicators to the asset pair, with this kind of same response a trader can be confident to enter into a trade.
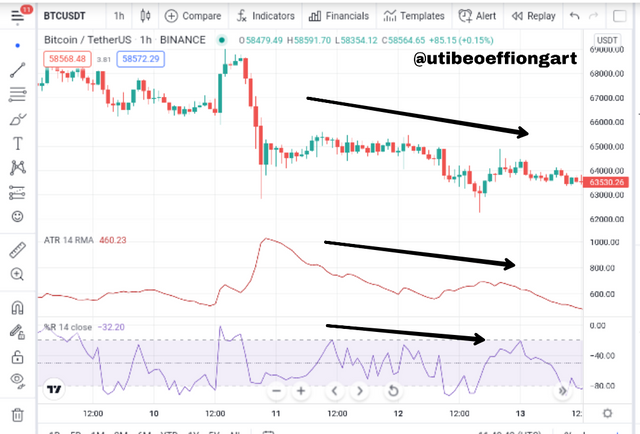
Also looking at the downturn response of the chart and the Indicators that is talking about the reversal, the two Indicators were in response as well as seen below.
Screenshot from trading view
But then using just the ATR Indicator can be of tremendous disadvantage looking at the fact that it can give false signal at some point. Now looking at the chart below.
Screenshot from trading view
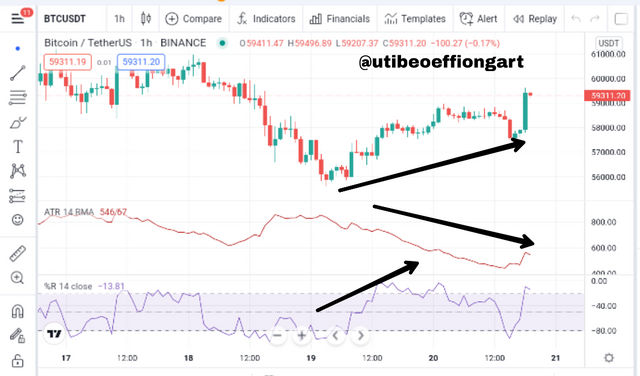
Now looking at the BTCUSDT chart above, you will see the divergence happening there. Now the ATR showed a low volatility at the arrow marked point. And it showed a divergence which was corrected by the %willaims Indicator. Therefore it is always important to use Indicators with other Indicators to reduce false signal.
How to know the price volatility and how one can determine the dominant price force using the ATR indicator? (Screenshot required
Price Volatility Determination
Screenshot from trading view
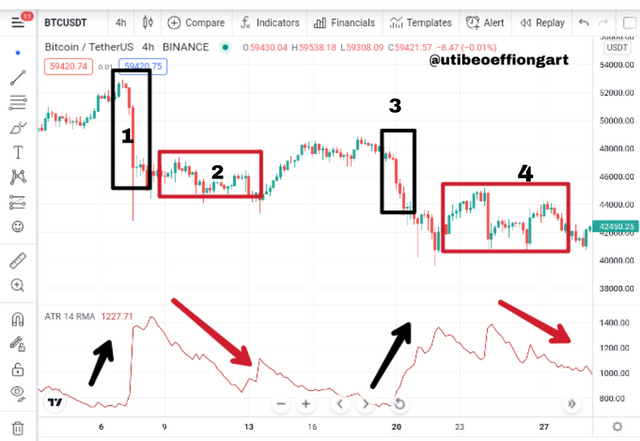
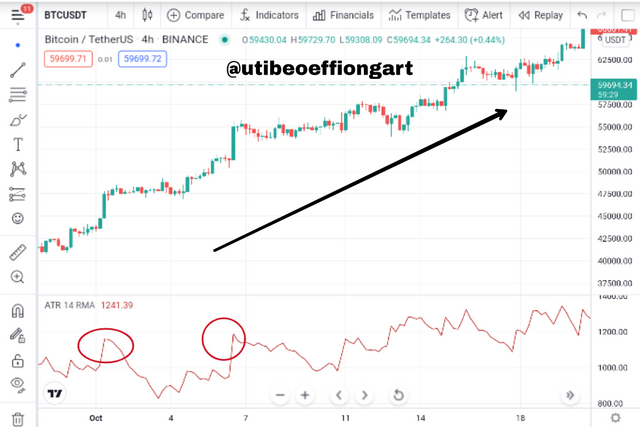
Now looking at the chart above I have segmented the candle sticks into numbers being 1,2,3 and 4. Now looking the first and third box being that of number 1 and 3, now the candle sticks showed longer sticks, longer candle sticks and high volatility is usually identified by this and apparently the Indicator showed same by an upward spike..
Very close to this boxes are other boxes showing price range that is a continuous movement of market price without a clear upward or downwards movement. Now this range price movement showed corresponding downwards or low volatility rate. These are just the simple volatility determination using this Indicator in particular.
Dominant Price Force Determination
Screenshot from trading view
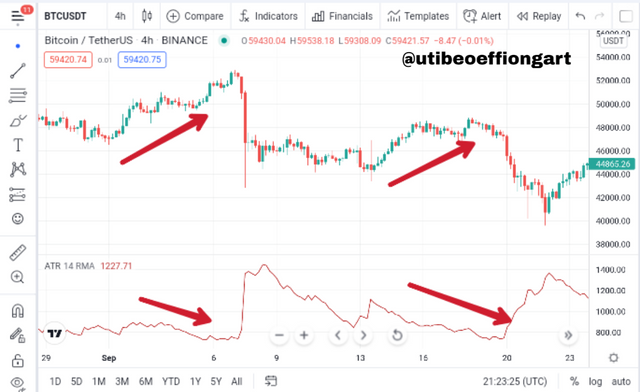
Now dominant price Force is basically a an act of identifying the trend the market is going to whether we are considering a bull or bear market price Force.
Now a market force can be identified easily with a help of an indicator, and then also help remove Fakeout to avoid trap on traders. Now look at the chart above, were the chart is showing divergence with the Indicator's line. Here the dominant force is not weighty enough that it why the Indicator to diverging.
But then look at the next move of the candle sticks where there are long candle sticks and the Indicator is showing a corresponding high volatility and this shows that the market force are true to the course. Here the buyer are in constant purchase of the asset making the candle sticks move in the direction it is moving.
How to use the ATR indicator to manage trading risk ?(screenshot required)
Managing Trading Risk with the ATR Indicator
Now during trading a trader can encounter a back turn even after all the odds had showed him/her that the trade will go on that particular direction. So to avoid things like this trade risk management is very vital. Therefore there are two Trade management tools available to help traders avoid kissing out on a trade. That it helps them either not to get into so much loss or exit a trade so much earlier than normal.
But then there is problem traders might encounter setting this stop loss and take profit positions at the best positions. This is were the ATR Indicator comes in to help traders remove this difficulty of were is best to set the stop loss and take profit positions. The formula below suffices;
Entry price +/- 3x ATR value
Setting Stop loss with the help of the ATR Indicator
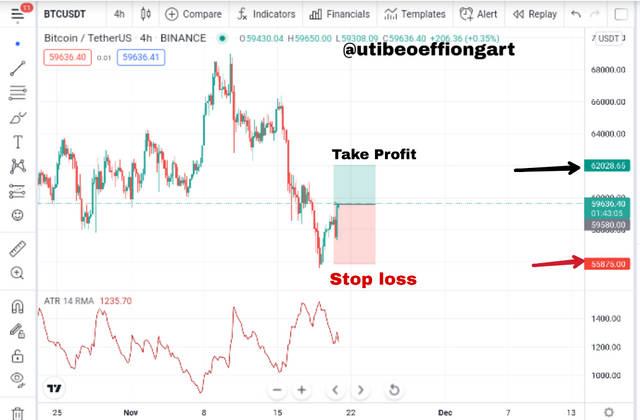
Now the stop loss is a technical analysis too that helps traders exit a trade or close a trading positions when the trade goes against your target or favor. Now using the above formula let's determine the stop loss position of a sell trade target;
Let;
Entry Price : 59580
ATR Indicator : 1235
Stop loss = 59580 + (3×1234)
= 59580-3705
= 55875
Now applying this to the chart we see below in a 1:2 risk position.
Screenshot from trading view
Setting Take Profit with the help of the ATR Indicator
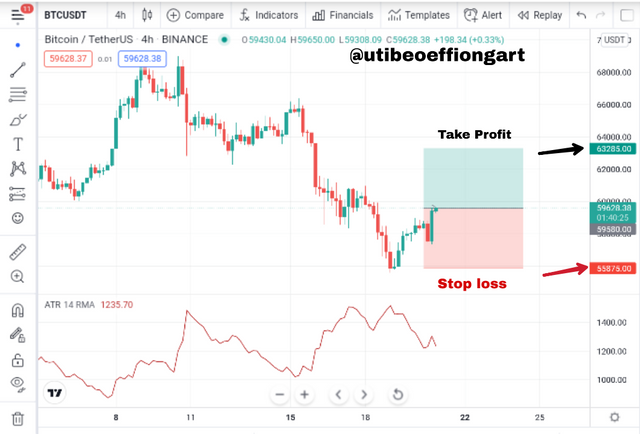
Now the take Profit is applied to a trade by a trader to exit or close a trading position when the trade is in the traders favour. Also using the formula let's apply it.
Entry Price : 59580
ATR Indicator : 1235
Take Profit = 59580 - (3 × 1234)
= 59580 - 3795
= 63285
Now let's apply this to a 1:1 risk margin asset Chart as seen below.
Screenshot from trading view
Now when setting the stop loss or take profit positions it is important not to make it too close or too far from the entry position so if the trade is either in or against the traders favour it will truly favour favor him or her. Here's is were the ATR helps out and that is what we have demonstrated above.
How does this indicator allow us to highlight the strength of a trend and identify any signs of
change in the trend itself? (Screenshot required)
Strength of Trend Identification
Now the ATR Indicator is not a trend detecting Indicator but then the strength of a trend like the RSI can be identified using the Indicator. This is possible when the point of spike of the Indicator line is noticed and this in turn pushed the assets candle stick to move in such such direction. So the spike might be identifying a strength of an upward or downwards movement depending on the direction of the larger candle sticks like seen below we have a upward trend movement were the strength was shown by the Indicator and the asset price took it on too.
Screenshot from trading view
Trend changes or Reversals
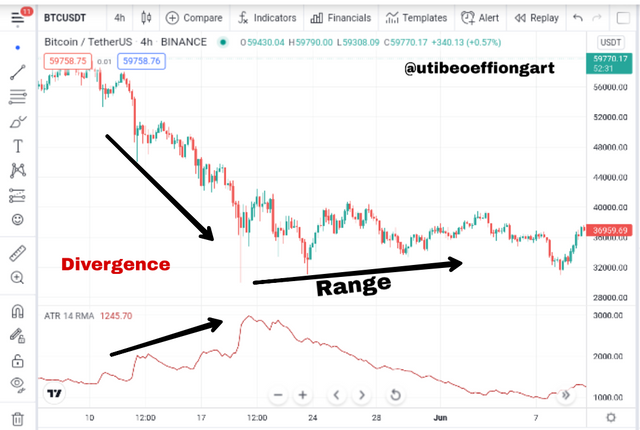
Now one of the easiest ways to identify trend reversal or change is when an Indicator and the asset chart shows a Divergence usually at the end of a trend this is quick signal to any trader that the asset price will soon take a U-turn or reverse as seen below.
Screenshot from trading view
Now looking at the chart above it got on a divergence and at the end it got changed direction to a range market. Now notice that the Indicator and the chart candle sticks were in divergence giving rise to the divergence.
List the advantages and disadvantages of this indicator.
Advantages of the ATR Indicator
The ATR Indicator is very easy to read age understand.
The ATR Indicator is compatible with other Indicators for optimum results.
The ATR Indicator very importantly helps traders to set their stop loss and take profit positions easily. Say it helps manage trading risk
The ATR Indicator works well with any time frame all dependent on the traders trading style.
Disadvantages of the ATR Indicator.
The Indicator works best with other Indicators to produce maximum result.
This Indicator is volatility based therefore knowing the trend direction through it could be Difficult it not impossible.
Conclusion
The ATR unlike most Indicators measures the volatility of a trading pair and measuring just the volatility of a trading pair could be of disadvantage at times. But then when used with other technical Analytical tools could really be of great Advantage to a trader and profit maximization is possible.
Thank you.