[Crypto Trading Using Zig Zag Indicator]- Cryto Academy /S6W1-Homework Post for professor @kouba01

Now to the assignment proper
Show your understanding of the Zig Zag as a trading indicator and how it is calculated?
Zig Zag Trading Indicator
As the name implies the zig zag indicator is a actually zig zag in nature were it shows the trader the market trend. But then there is an important part of the trend it shows in that it filters out the regular fluctuations experience in an average daily market expedition. So those noise of ups and down while the market is trending either in an uptrend or downtrend is eliminated because of the concentration of the zig zag indicator on major price fluctuations.
It is worthy of note that during the use of this indicator, the market price fluctuations is set to a particular fluctuations or movement percentage, so the price fluctuates to the tune or degree of the percentage set. The zig zag indicator majorly deals with crest and lows which is the point of resistance and support of the chart. The percentage setting of the price trend is basically done by the trader depending on the trading strategy and time frame in use.
The zig zag indicator does not necessarily gives trade signals and reversal point, but on a whole the zig zag indicator gives a bigger picture of a trend flow while eliminating the noise of a normal chart.
How to Calculate the Zig Zag Indicator
Now calculating the zig zag can be easily explain to depict the operational proceed of the zig zag indicator. The zig zag indicator which is basically a line drawn from point of up tides to point of low tides and makes new moves as the price keeps fluctuating. Now a terminology called Deviation determines the basic calculation procees of the zig zag indicator.
Now the Deviation is the rate at which price fluctuations in the chart activities can cause the zig zag indicator to change direction from it originally formation to a new movement pattern. The zig zag indicator which is drawn from a point of crest to a point of point of support. This drawing by the zig zag movement begins in a new direction due to the percentage fluctuation of the chart price.
What are the main parameters of the Zig Zag indicator and How to configure them and is it advisable to change its default settings? (Screenshot required)
Main Parameters of the Zig Zag Indicator
There are two main parameters in use in the zig zag indicator which are the Deviation and the Depth as seen below at the configuration section of the indicator.
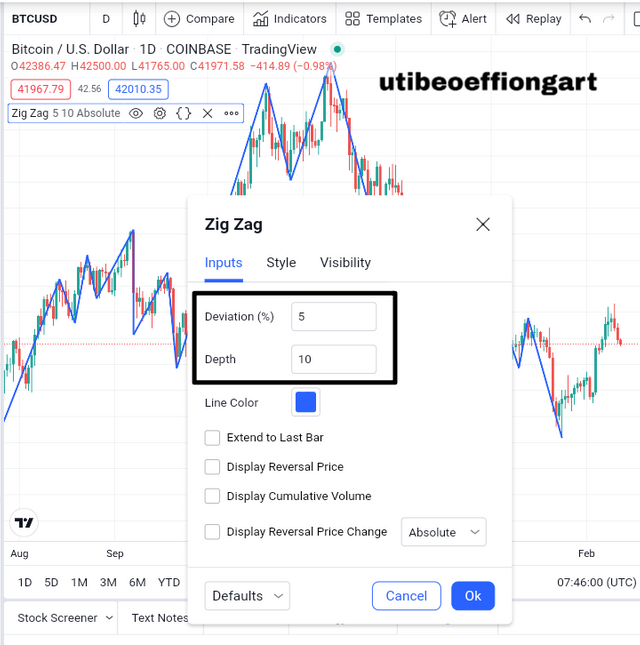
Screenshot from tradingview
Deviation: like earlier explained, it is the amount or degree to which the price can fluctuate there by causing the zig zag line to change it direction. It is worthy of note to know that the default setting for the deviation is usually 5. While the
Depth: This is the shortest distance of fluctuation of price candles needed to cause another deviation on the indicator. It is usually 2 times the deviation, so at default it is 10.
How to Configure the Zig Zag Indicator
Now to configure the zig zag indicator you have to first log into the https://www.tradingview.com/ platform and then choose the crypto pair of choice which I choosed the BTCUSD pair here.
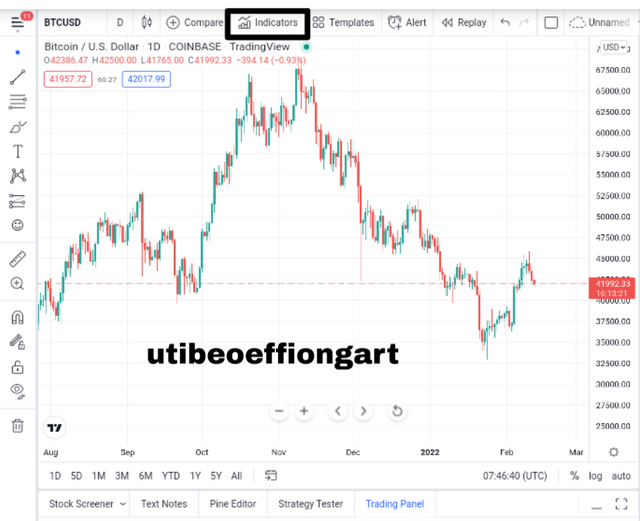
Screenshot from tradingview
- After choosing the pair and chart comes up, you then click on the indicator button as seen above and the page below will pop up.
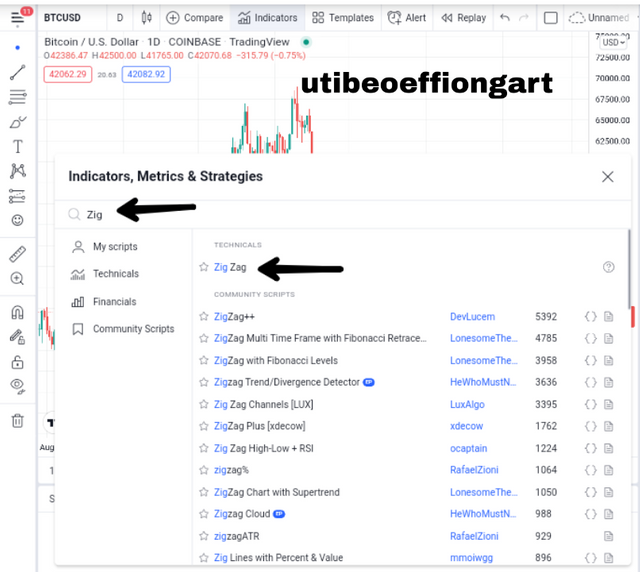
Screenshot from tradingview
- Then the choose the indicator of choice, in this case the Zig Zag indicator is chosen after that the indicator appears on the chart.
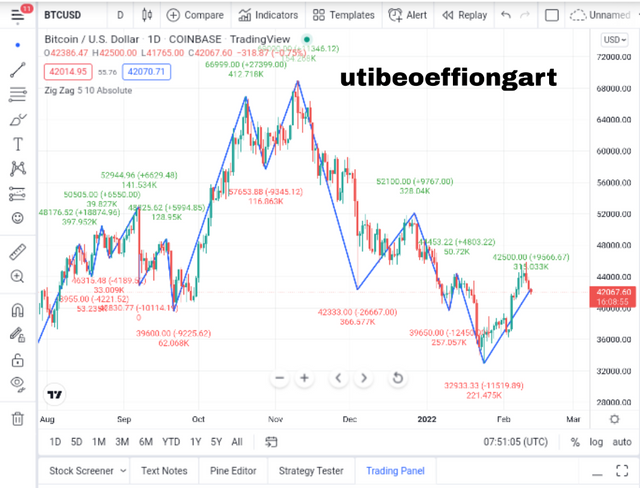
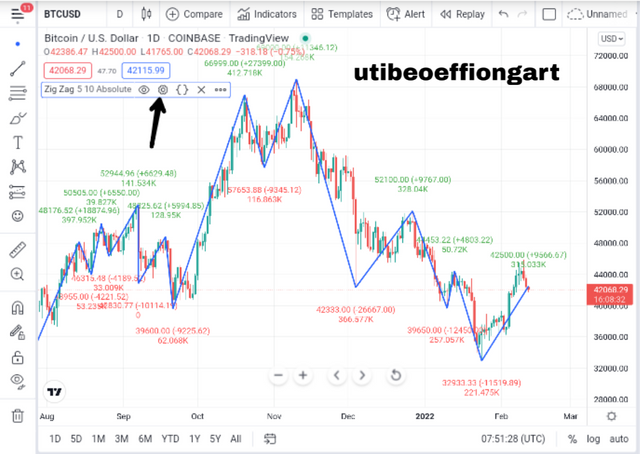
Screenshot from tradingview
- Looking at the chart above the indicator is inputted into the chart but then the chart graph looks very noisy, so I had to unmark some of the features to reduce the noise at the input section of the configuration to reduce that.
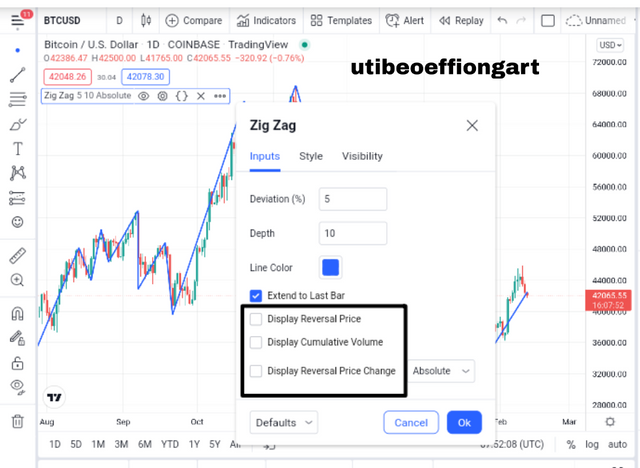
Screenshot from tradingview
After clicking on setting, the setting platform pops up then the input section comes off first, here I only unmarked the marked features and the noise went off as seen below.
Screenshot from tradingview
After that I proceeded to the next Configuration which is the style as seen below.
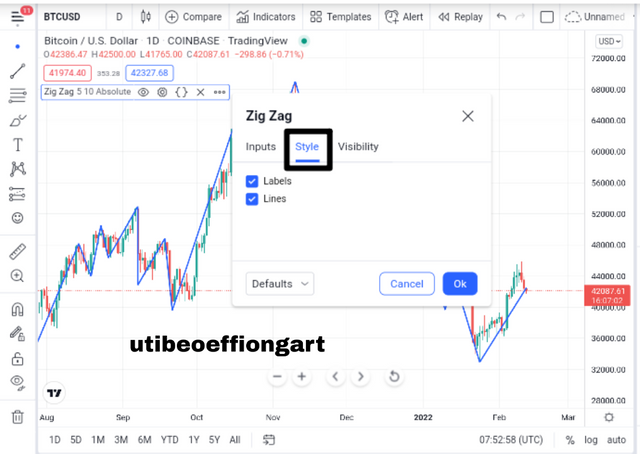
Screenshot from tradingview
- Looking at the style section, I did not make any adjustments because the features are actually very needful in the workings of the indicator. After that I get to the next setting feature.
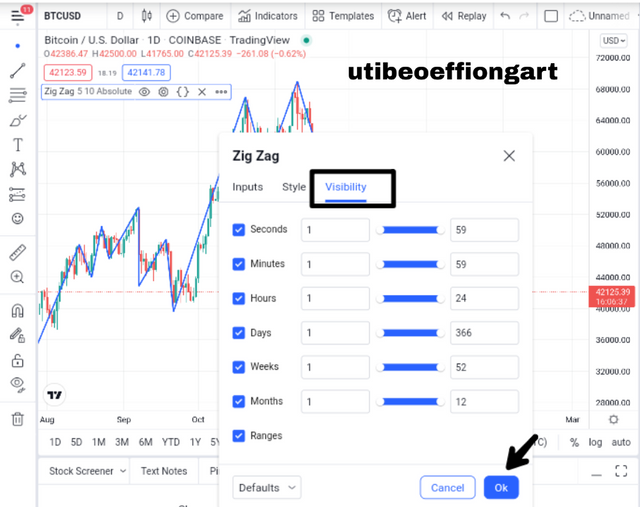
Screenshot from tradingview
- This part of the configuration which is the visibility is usually the part were the indicators activities level and display can be adjusted. Here there are not much distraction on the indicator, so it is allowed to stay. Below is the final Configured chart with the zig zag indicator.
Screenshot from tradingview
Is it advisable to change its default settings
Naturally it is not advisable to change the default settings of an already set indicator by the creator of such indicator based on the fact the creator had some specific reasons for the use of that and choosed that as the best to be utilized by expecially amatuer traders.
But then if a traders has much experience he/she can adjust the indicator to what best fit him or her and suitable for the trading style in use because that also can be to a great extent a determining factor.
So though it but very advisable to change the default settings of an indicator but then based on the trading style and the experience of the trader then he/she can always adjust the Indicator setting to his/her best fit.
Based on the use of the Zig Zag indicator, how can one predict whether the trend will be bullish or bearish and determinate the buy/sell points (screenshot required)
Bullish and Bearish Trend Determination.
To determine the trend flow of a Crypto asset chart using the zig zag indicator is a very simple process, which is base on the observation of the market flow chart.
For Bullish chart
Screenshot from tradingview
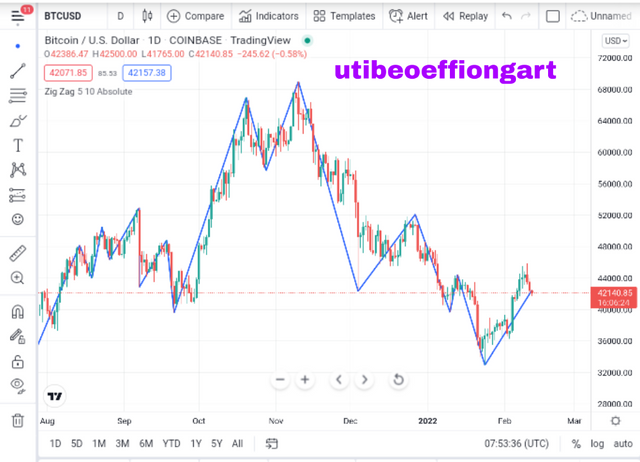
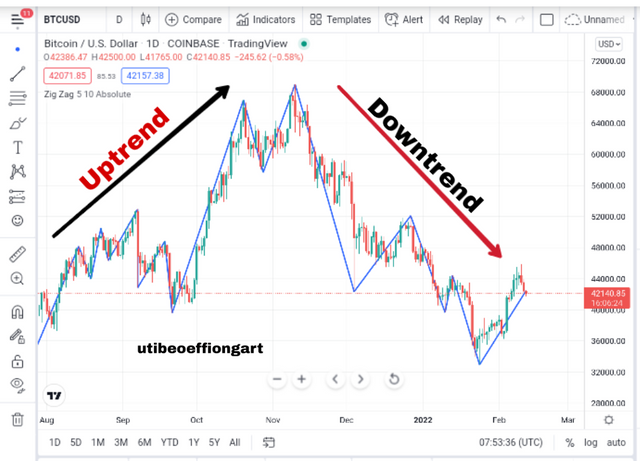
As seen above, the BTCUSD chart shows a trending market of an uptrend and downtrend, but we will focus on the uptrend aspect of the chart, were the zig zag indicator helps us identify that. Now like I said before it is very simple to use the indication to identify this trend, in that when the market price makes some consecutive higher highs with the previous high getting lower than the current high with this a trader should be able to detect an uptrend because even the zig zag indicator will follow suit.
For Downtrend Chart
Screenshot from tradingview
Also looking at the chart above we will focus on the downtrend. Like I started before identifying this trend also is very easy. So when the candles make continues lower lows with the current lower low being lower than the previous lower low or lower high then this progression between said to be a downtrend.
Buy entry Determination
It is worthy of note to understand that trend reversal can also be identified using the zig zag indicator which is one of the very important ways to identify the entry point of the chart. So in identifying a trend reversal, this is noticed when a trend is in motion then at some point it begins to become week that is not making the same level of higher high or lower lows again then the trader involved should know that a trend is about to change it direction.
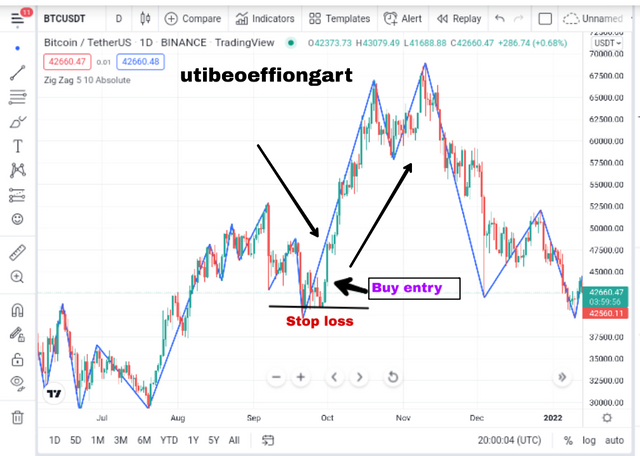
Below is a chart showing a buy entry point which is identified when a downtrend gets week and begins proceeding to an uptrend.
Screenshot from tradingview
As seen above, the buy entry position is placed with a stop loss inputted just below the last lower low that made the proceeding higher low. This is done to avoid loss incase the trade goes otherwise. And it is place at a rate of 1:1 risk level.
Explain how the Zig Zag indicator is also used to understand support/resistance levels, by analyzing its different movements.(screenshot required)
Support and Resistance levels
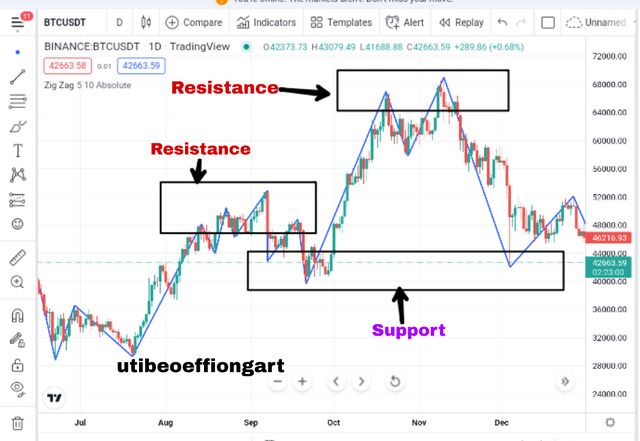
Identification of the support and resistance levels in a chart is also make easy using the zig zag indicator. This zig zag indicator shows a trader the bouncing point of the market price whether at the top or at the bottom giving the trader an overview of the support and resistance point as seen below.
Screenshot from tradingview
Now the chart above shows a spell out of corresponding crest point and low point all marked in a box as I have done afore. It is important to note that the tops formation is the resistance point were the candle sticks hit and find it difficult to proceed upwards so it pulls downwards. Same thing with the support levels were it continues low point is hindered by the market force and so it is pulled upwards.
How can we determine different points using Zig Zag and CCI indicators in Intraday Trading Strategy? Explain this based on a clear examples. (Screenshot required)
Determining positions with the use of zig zag and CCI indicator.
Now as recommended by the question of professor for an intra-day trading style I used the BTCUSD chart with the an hourly time frame being 1hr for that purpose. Then I proceeded to combine the chart with two indicators being the CCI and the zig zag indicator to confirm points and I used that to pull out two point of buy and sell point.
The CCI indicator is parted into two segment the positive and the negatives which depict the upper and the lower segment showing uptrend and downtrend respectively. The Indicator is numbered in 100's, so we have the positive 100's and the negatives 100.
For a buy position, looking at the chart below you will notice a formation of resistance positions at some point signaling that sooner or later, at a point of weaker candle formation that the trend will change. Soon the the resistance point was broken for an upwards movement. Looking at the chart the zig zag indicator corresponded with the uptrend pull shown also by the the CCI indicator.
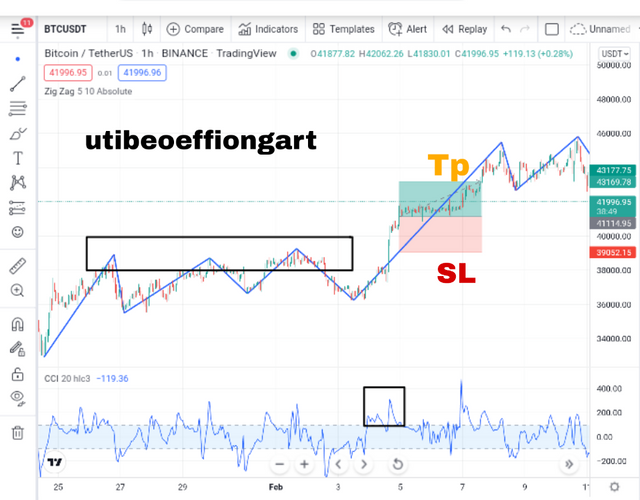
Screenshot from tradingview
Also for a sell entry we see a mark out of the support positions were the market price could not break but kept circling around they, then at a point just after the third support level it got
a break out and proceeded for a downtrend. The CCI indicator also corresponded with the zig zag indicator there giving more assurance for a sell trade entry.
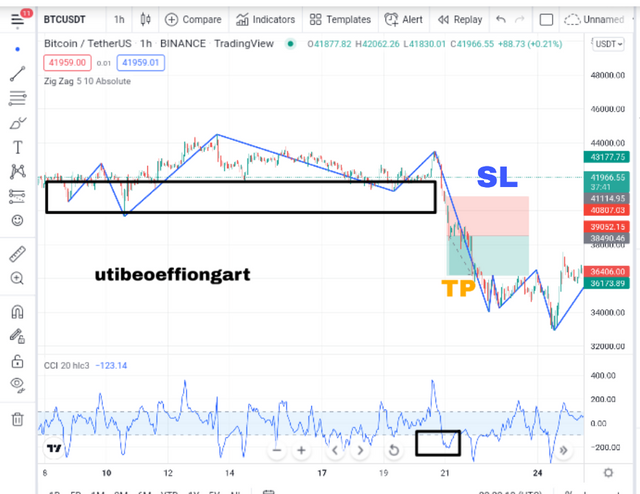
Screenshot from tradingview
Is there a need to pair another indicator to make this indicator work better as a filter and help get rid of false signals? Give more than one example (indicator) to support your answer. (screenshot required)
Combining the zig zag indicator with other Indicators
Now combining the zig zag indicator with other Indicators is very necessary expecially for filtering out of false signal because it follows the chart price giving a whole view of the market price. But on a whole it is very much needed for confirmation and simplification of the viewed price action in the chart. Below are a combination of the asset with other Indicators firstly the RSI and then the MacD Indicator.
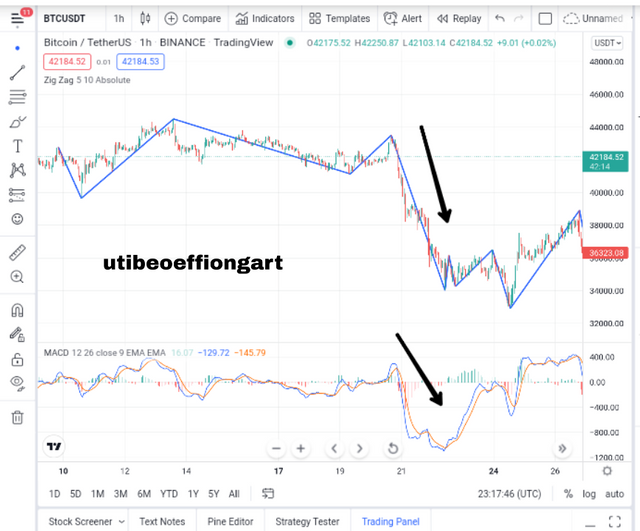
Screenshot from tradingview
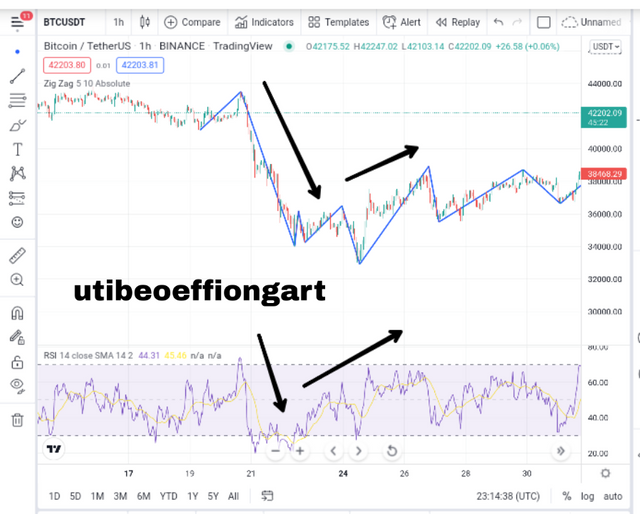
Screenshot from tradingview
It is worthy of note to know that no indicator can work in isolation therefore the need to always combine an indicator with others in order to minimize errors during trading.
List the advantages and disadvantages of the Zig Zag indicator:
Advantages of the Zig Zag Indicator
The support and the resistance levels can easily be detected.
With the zig zag indicator price action can easily be monitored.
Follows the candle sticks so the case of false signal is not invoked.
Former chart actions can easily be analised with this indicator.
Disadvantages of Zig Zag Indicator
It is not very easy to use especially when entering into a position.
Combining with other Indicators is eminent because the zig zag is majorly trend based vis a vis the need for other Indicators.
Conclusion
Conclusively, the zig zag indicator is another very interesting Indicator that is to a traders advantage expecially in identifying trends and if a trader can easily identify trend especially in an early build up stage then that trader has a lot of advantage.
The zig zag indicator as the name implies is zig zag in nature and so follows candles to produce a seemingly a candle stick moving pattern. But the advantage with this is that is filters out unnecessary noise of the candle sticks and allows for a good flow of trend.
Thank you