Trading Using Wedge Pattern] - Crypto Academy / S5W5 - Homework Post for @sachin08

Good day everyone, how are you all doing?
I welcome you all once again to this weeks' S5W5 of Steemit Crypto Academy Class, which is about Trading Using Wedge Pattern, for the past weeks' classes we have learned about Recognizing patterns in Trading using the Triangles, Flags, and Rectangles, with the professor lectures on all these patterns, we were able to learn and understand more on the patterns and we were able to apply all this to real-life trading.

Q1. Explain Wedge Pattern in your own word.
wedge pattern can be defined as a price pattern that is used to know the exact direction and pattern the price in the market will be taken, the two converging lines are what traders used to connect the highs and the lows of the market price for a specific period of time.
With the use of a wedge pattern, traders can determine when the market trend is going to be a continuing trend or a reversal trend, when the trendline is drawn when the price pattern runs towards the upward direction, it shows that the market price will soon experience a fall in price.
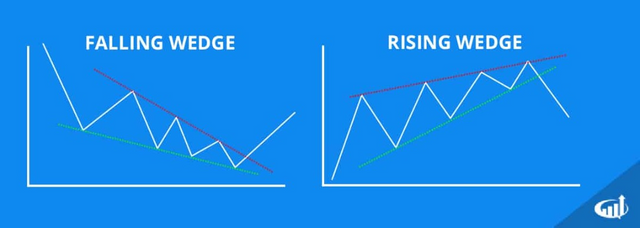
The wedge pattern has two parts which are the rising wedge pattern and falling wedge pattern. The rising wedge pattern takes place when the market price is leading towards the uptrend, and along the line, they seem to be a pause along with the pattern, which also indicates that the market will experience a fall in price where the trendline will fall towards the downtrend, so in this kind of situation, the traders tend to draw a rising wedge trendline along with the uptrend pattern.
While the falling wedge pattern is drawn when the market price experience a fall in price where the price in the market is in favor of the sellers, they are indications that they will be a breakout in price where the market price will experience an uptrend in the price pattern.
Q2. Explain both types of Wedges and How to identify them in detail. (Screenshots required)
Like I explained earlier that the wedge pattern has to be the part that is identified with a trendline, these parts are what we call the rising wedge and the falling wedge.
The Rising Wedge
The rising wedges is a bearish chart pattern that occurs when the market price continues to rise for a while, along with the rise in the pattern the traders tend to draw a trendline to anticipate when the price chart pattern will fall and trend towards the downward slope which indicates that the price chart pattern is trending along with the bearish chart pattern.
When drawing the two trendlines which are used to indicate the rising wedges, along the rising price patter the two trendlines tend to connect the price highs and lows along the chart patterns, which later meet at a certain point in time and the point of interception is where mostly where the price pattern in the market changes direction from upward movement to downward movement in the chart pattern and that's where we have our bearish price pattern which also indicates that the wedge is a rising wedge
Mostly the rising wedge helps traders to know that they will be a potential drop in market price after a breakout occurs in the price pattern which leads towards the bearish price pattern, after which the sellers tend to take over the market price for that period of time.
The trendlines contraction occurs when the higher lows(support line) and higher highs(resistance line) converge with each other as the price pattern rises, along the line the speed at which the support line grow began to slow down which is the reason why the distance between the resistance line and the support line tend to contract and the resistance line later catch up to the support line and they meet at a point in time, which where the market tends to have a breakout, the market price also have a fall out which indicates the market is running along with the bearish pattern.
Falling Wedge
The falling wedge is a bullish chart pattern that helps traders to know when the market will experience what the traders called the bullish period or bullish time, this bullish time is a situation where the market experienced a sudden rise in the market price for a specific time, with the help of the falling wedges the traders were able to pinpoint the exact time the market price will rise.
The falling wedge takes shape when the lower highs and the lower lows line connect at a certain point in time, the two trendline moves towards the downtrend and ends up converging at a point in time, they tend to be a breakout along with the downtrend which also acts as a sign for traders to know that will soon be an uptrend in the market price pattern.
The falling wedge can either be a reversal signal or continuation signal, in the case of a reversal signal, the trendlines are formed along with the downward movement in the price chart pattern which indicates that the next coming trend will be an uptrend in the price pattern which shows the bullish pattern, while the continuation signals formed when they are an uptrend in the market pattern then experience a slight fall in the pattern, the movement shows that the uptrend will still resume shortly after the fall.
Q3. Do the breakout of these Wedge Patterns produce False Signals sometimes? If yes, explain how to filter out these false signals.
Yes, they do produce false signals because in trading when traders enter the market to trade they all know that no matter how good their market strategies are they cannot be devoid of fault which means that they are no guaranty of having 100% accuracy in their predictions. But still, this doesn't mean that their prediction is wrong just that the market can sometimes go the other way round.
But still, the traders can only predict as much so that they will always minimize their losses when the market goes the other way, the same thing with traders using the wedge pattern in predicting the direction the market will take, the false signals is one of the crucial points that most traders worried on when they are predicting the time when the market price will either be towards the bullish price which means the wedge pattern is a falling wedge or if the market is going towards the bearish pattern which also signifies that the wedge pattern is a rising wedge pattern, also for them to determine if the price pattern is still going to continue the initial direction it is on or they will be a change in direction because sometimes when the market price is going along the bullish pattern, they might be a sudden change in direction towards the bearish pattern and sometimes these change can either continue going towards the bearish pattern for a while or suddenly shoot back up towards the uptrend which means that at that particular time the market experience a false signal. This kind of situation is what the traders called "the market deception" or "the market bait". Quite many traders mostly fall for this kind of situation when trading because most of them are in haste to make their entry and at the end of the day they end up falling for the bait.
After traders understand that sometimes they tend to be false signals in the pattern the market takes, many traders tend to trade with caution which also helped them in minimizing their loss and also for them not falling for the market bait all the time, traders tend to wait to see either the current market trend will continue or the direction will change, most time the market tend to continue to stay in the current direction for quite some time and some traders who are not patient enough will end up believing that the current direction is the direction the market is taken, ends up making a huge loss, while most experienced traders know that it is common to have a false signal when they are making trade so after seeing the current market direction, the traders tend to wait it out so that they can a perfect entry by the time the market pattern resumes.
In this kind of situation where traders are faced with indecision, not knowing the right time to enter the market because of the fear of falling for the false signals, the best thing to do is to wait it out for the market price to close outside for at least 2 to 3 days so that when the market pattern resume then it won't be too late to make an entry.
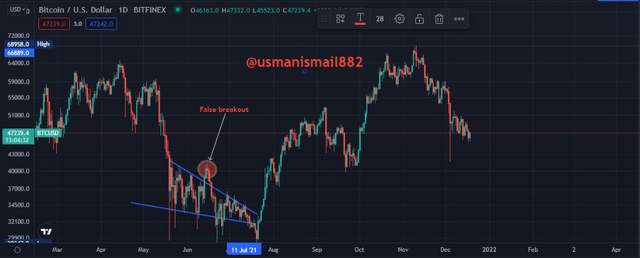
And from the image above, it can be seen that the market direction is along with the bearish pattern and after sometimes the market shoot upward indicating the bullish pattern and it stays up for a while before shooting back downward which indicates that the market resumes back the bearish pattern, this shows us that the market pattern experience a false signal.
For traders to have a clear picture of how the market pattern will play out, most traders tend to make use of other indicators which also helped them in knowing when they will be a false signal in the market and also when the market will resume the former trend, one of the widely used indicators is the (RSI), this indicator is mostly used because it helps traders to know how strong is market reversal is at that time, also help traders on if they are to make an entry or to wait it out.
Q4. Show full trade setup using this pattern for both types of Wedges. ( Entry Point, Take Profit, Stop Loss, Breakout)
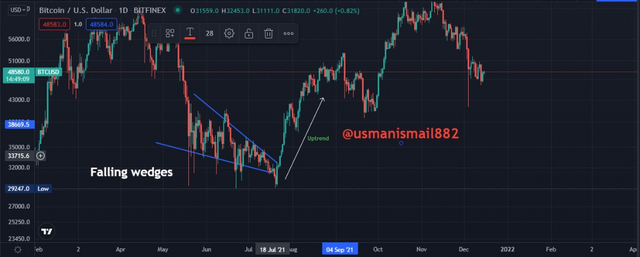
Falling wedge setup
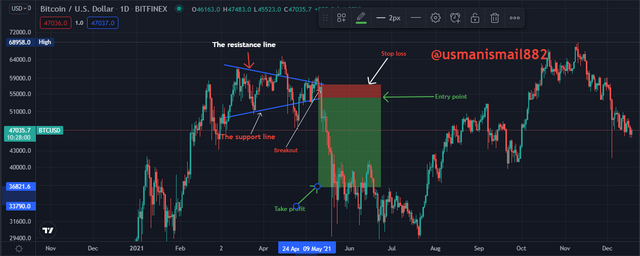
From the image above we can see that the wedge pattern trendline that was taken go toward straight down the slope which indicates that the sellers are currently the ones dominating the market but along the line, we can see some resistance from the bull pattern which indicates that the buyers haven't given up yet and along the line, we can see the buyers winning some momentum in their struggle, which also gives the traders the perfect opportunity to predict the exact direction the market will take when it reaches a certain period the resistance line and the support line converge which courses the price pattern to shoot up towards the bull trend, which also gives the traders the perfect time to make their entry.
This is why I make my entry immediately after I noticed a breakout when the market price is at 32120.4, then I make my entry at 32404.7, after which I decide to take my profit point at 46201.3, also to stop my loss when the price is at 31768.5. So that I will be able to maximize my profit and minimize the loss.
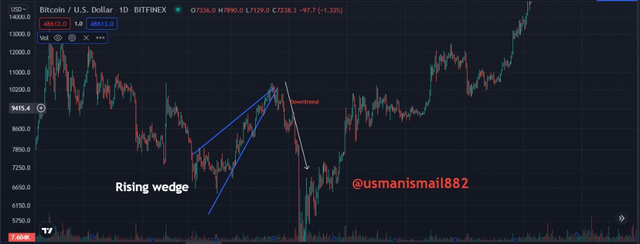
The rising wedge setup
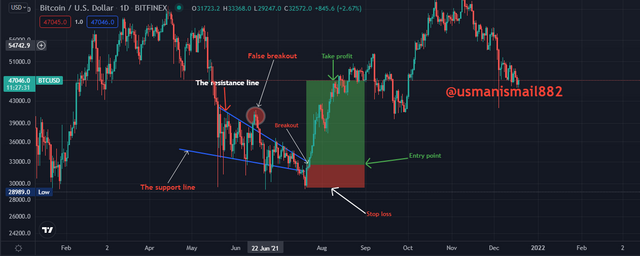
From the image above we can see that the wedge pattern trendline that was taken go toward the uptrend slope which indicates that the buyers are currently the ones dominating the market but along the line, we can see some resistance from the bearish pattern which indicates that the sellers haven't given up yet and they is a strong resistance coming from the sellers so that they can take over the market, we can see the sellers are gradually winning some momentum in their struggle, which also gives the traders the perfect opportunity to predict the exact direction the market will take when it reaches a certain period the resistance line and the support line converge which courses the price pattern to shoot downward towards the bear trend, which also gives the traders the perfect time to make their entry.
This is why I make my entry immediately after I noticed a breakout when the market price is at 55839.2, then I make my entry at 55349.3, after which I decide to take my profit point at 35703.0.1, also to stop my loss when the price is at 56401.6. So that I will be able to maximize my profit and minimize the loss along the trendline.
Conclusion
From our observation and the explanation so far we can see how awesome the wedge pattern is in predicting the right direction the market price will take at any given time, which also helps traders not to fall for the false signal that normally occurs in the market pattern, also it helps to indicate the accurate time traders are to make their entry. Thanks to professor @sachin08 for taking his time to explain the course and also indicating the crucial points all traders are to observe when trading while using the wedge pattern to analyze the direction the market is taken.
Cc;