Crypto Academy / Season 3 / Week 2 - Homework Post for @cryptokraze - Market Structure


Market structure is the easiest lookout and reading of change in price and how to understand it. It is essentially the opposition levels on the charts both high and lows. These are levels, which are effectively distinguished and hold until they don't. Market structure is a pattern following instrument that traders follow dependent on how a cyrpto currency moves. From bullish moves, to bearish and in the middle with ranges. Market structure is frequently in motion which is also called the price action. We refer the examination of price motion as market structure since it's the manner by which the entire market moves. Comprehend the pattern and the expected moves and afterward you can add different measures to your trades. Market structure is basically to understand the fundamental of how market moves and it deals with price. It's been made simpler with only three sorts of market structure. The market pattern has 3 unique ways at some times and getting familiar with them when a change happens depends on the time span you watch and is crucial to trading . The market structure are:
- Bullish
- Bearish
- Sideways

What do you understand about Lower High and Higher Low? Give Chart Examples from Crypto Assets.
Understanding of the market structures is where the higher low and lower high sets in. As they will be used to explain the forms of the market structures. Regardless of what time you take a look at the market you will discover a particular type of trend which is characterized by the increase or fall of the graph in the market you are look at.
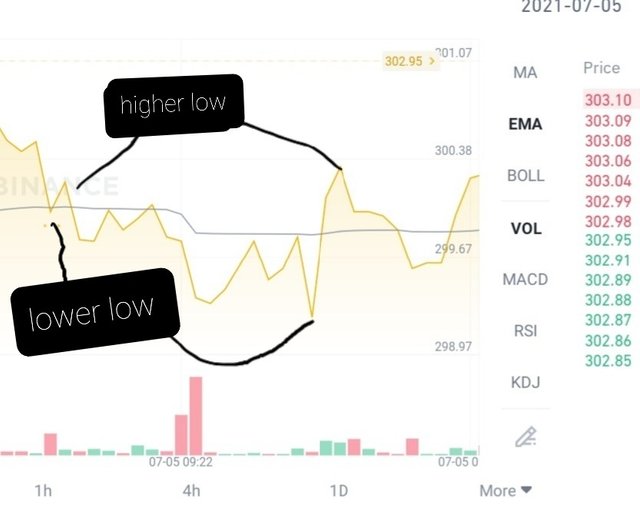
The higher lows
The higher lows occur in a bull market. A Bullish market structures trend is portrayed by higher highs and higher lows. The pattern will proceed toward that path until a lower low occurs in the market. The trend starts to give indications of shortcoming when it neglects to continue with that trend. The higher lows occur after and increase in the trend in a particular market structures drops back a little but not to the level at which the increase start from. The price at the higher lows gives a gain no matter how little it is from the start point of t one frame of any market structure. A higher lows can not be in a market structure without an higher high which is the initial increase of the price action from the start point of the market in start.
The lower high
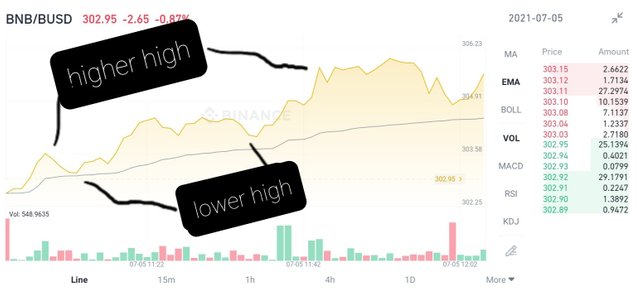
The lower high is a character of the bearish market structure . Bearish is portrayed by the activity of lower lows and lower highs. The trends will keep on falling so far as lower highs keep on occuring, when a higher high comes into the concept, the trend will end. The sign that the market might be changing from bear to bull starts when the market prints higher lows or equal lows.
The lower high occur after a decrease in the trend in a particular market structures changes an increase a little but not to the level at which the decrease starts from. The price at the lower high gives a loss when compared to the entry point of the market view. A lower high can not be in a market structure without an lower low which is the initial decrease of the price action from the start point of the market in the first place.
Note: The sideways is a market trend that has equal highs and Equal lows. The price action in a market during sideways is in a certain range of the market and is in combination. A Cryptocurrency price can move in a range for quite a while. This trend is broken if the price breaks out from the top or lower part of the range. This could be the start of one of bear or bull.
Identification of trend reversal deals with study of the Market Structure to notice a deviation from one form of trend to another.
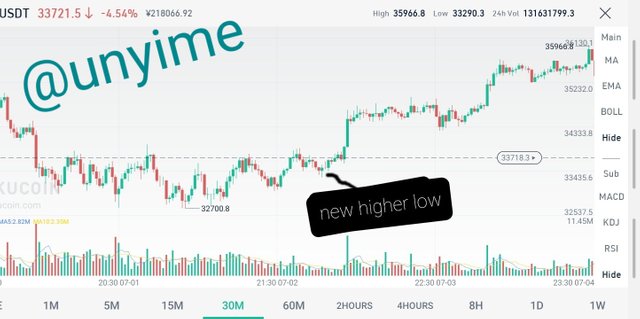
The formation of a new high low or a new low high in a series of threshold give a different pattern to the earlier notice market trends is a sign of trend reversal. This can be used to identify trend reversal when study within a given time frame, you will notice a side ways trend in the market structure which might not really be equal but follow either the bullish or bearish trend before the formation of a new high low or a new low high with is a perfect way to identify a break in the market structure. When a market structure that is either bullish or bearish start to give a sideways trend this is also and identification of a reversal in the trend as a change in the price action is preeminent after a sideways trend in a bearish or bullish trend.

A breakout can be a beneficial and profitable point if the trend is studied precisely. The entry and exit point assume an essential part in the accomplishment of a trade. Also, accordingly, no trading strategy can be produced without an appropriate section To enter and exit the market. These days, a few specialized bot are been built that one can utilize while taking a trade. Nonetheless, the most ideal approach to be Profitable trade is to develop your own model.
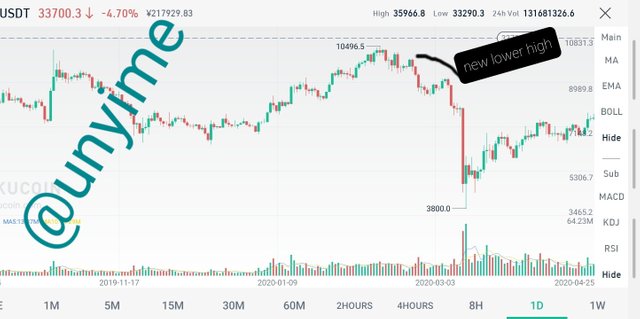
The entry point Could be gotten from the chart and candle stick. One approach to wipe out the noise is to trust that the price will settle after the breakout. Furthermore a time frame to study the Market depending on how time you are willing to stick to the trade. The market structure to buy a coin should have a trend of the Higher Low after the Lower Lows in the bearish market structure which will include a clear break in the market structure. The Market entry point to sell a coin morely in a Bullish run should have a market structure where a Lower High is present after a series of Higher High.
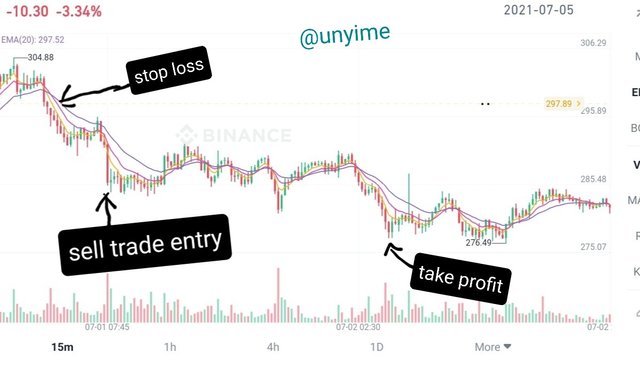
The exit point are just two different ways you can exit a trade either by making a profit or by making a loss. When discussing exit strategy, the terms take profit and stop loss orders to dictate the sort of exit being made. These terms are abbreviated as "T/P" and "S/L".
The time to be spend in the trade and the amount of risk you are willing to take hold a sole role in exiting a trade.
S/L are orders you can put with to sell your coin naturally at one point, or price. At the point when this price is reached, the S/L will be changed over into a market order to sell your coin automatically. These can be useful in limiting loss if the market moves rapidly against you. S/L are constantly set over the current buying prices on a buy, or beneath the current selling price on a sell. The T/P is stick to the same rule in the market just that they are order to sell when profit is been made.

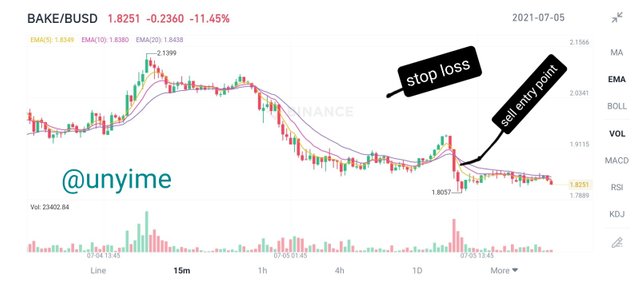
My first trade demo is on bake/busd market. After study the market on a 15min candle stick analysis. I made a sell entry on bake/busd at $1.85 and set a stop loss at $2.03 and a take profit at $1.67. the risk ratio I used is 1:1 so as to make it simple and profitable as possible.
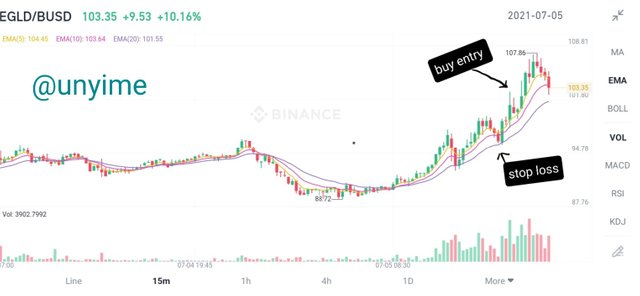
My second trade demo is EGLD/BUSD market. After noting the market structure and clearline on a 15 minutes candle stick price action, I place a buy entry on egld at $ 102.68 with a stop loss of 94.78 and a take profit of $110. The risk ratio of 1:1 was used.

Market structure break and other price action methodology are the executives strategies which incredibly upgrade trading skills by killing emotions and lessen risks. Before you enter a trade, consider the answer I gave to the heading in my write up and set a point where you will buy for a profit and a point where you will sell for an profit. The indication of the higher high, lower high, lower low and higher lows as used in the entry and exit point of a trade and to determine the stop loss and when to take profit are the technical analysis given by the market structure and the idea is amazing. It improves your analysis to trade markets more efficiently. Any crypto currency at any given time frame.
CC: @sapwood @kouba01