Understanding the Trix Indicator- Crypto Academy /S6W3-Homework Post for kouba01

Greetings fellow members of this platform, it is a pleasure to be a part of this week's activities for Season 6 of Crypto Academy. The lesson this week is on a technical indicator that would assist in trading when incorporated to one's arsenal of trading techniques. I would handle the tasks given by the professor without further ado.

Trix Indicator
Trix stands for Triple Exponential Index because of its method of calculation. It is an oscillator that shows overbought and oversold regions in the price of an asset.
This indicator works by showing the momentum of price. This means that it gives the extent to which a trend has gone, and signals when a new trend would begin.
The triple exponential averages make it possible to filter false signals that would have been given by one EMA. This improves the accuracy of technical analysis and leads to more accurate trades.
It is to be know that the Trix indicator is used for more correct forecasts, therefore making it a very important tool for technical analysis. The overbought and oversold regions are more defined with this indicator and as such, better trades can be made.
Calculation and Graph of Trix Indicator
Here is what the graph of the Trix indicator looks like below:

The indicator can be described as an oscillator that moves about a horizontal line called the zero line. The relative position of the oscillator to the zero line determines if the indicator is positive or negative at a give time.
Hence, the trix indicator is calculated using the formula below:
EMA1 = EMA(Close)
EMA2 = EMA(EMA1)
EMA3 = EMA(EMA2)
∴ TRIX = (EMA3 [today] - EMA3 [yesterday]) / EMA3 [yesterday]
The indicator uses the averages of three EMA so that it would not be affected by sudden price movements and the volatility of a single EMA.
High values are used for the period of the indicator so as to get smoother signals. High values for the indicator would mean that the indicator takes into account longer time periods before giving signals. Short time periods would be affect by insignificant changes in the price of the asset.
This begs the question: Is it advisable to change the settings of the indicator? The answer is yes. The settings can be changed to suit the volatility of a particular market, but it is still best to use large values (like 18) for the indicator so as to filter sudden price changes that would not have an overall effect on the market.
How to Configure the Trix Indicator
To configure the indicator, you need to click on the settings icon as seen in the image below.
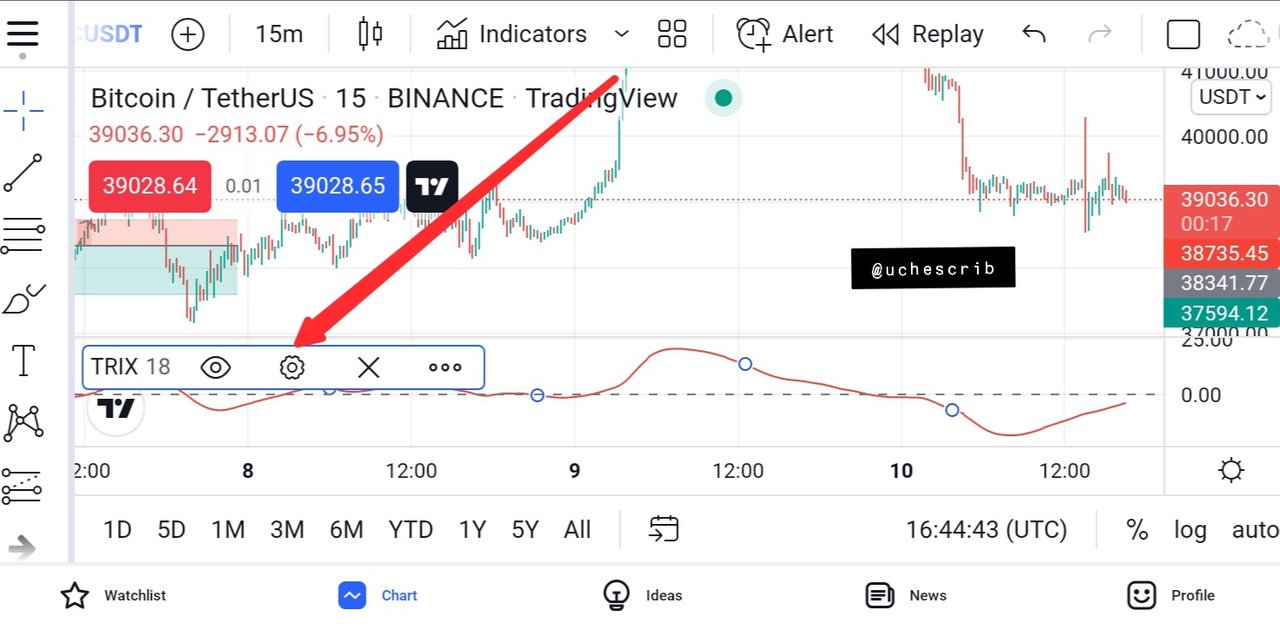
The configuration consists of the following:
Inputs: For setting the values of the indicator for suitable analysis.

Style: For setting the indicator to be more appealing and suitable to the user's visual sense.

Visibility: For selecting the timeframes that the indicator should appear on the chart.

Using the Trix Indicator to determine Trends, Entries and Exits
The Trix indicator signals an uptrend when the oscillator moves above the zero line. This situation is also a good buy entry as the price of the market is expected to increase to significant levels.
On the other hand, the oscillator moving below the zero line signifies a downtrend. A sell signal is given off by this downtrend movement. In this situation, a short position can be opened and profits taken at desired regions.

The image above illustrates these situations using the Trix indicator. The indicator is seen crossing the zero line at point A. A great bullish movement was then observed as the signal was given. This served as a good region to open a long position in the market.
Region B shows the oscillator crossing the zero line and moving downwards. This signalled a great bearish pull in the market and was a good region to make a sell entry in the market.
A region before point A shows indecisiveness in the market as the oscillator does not completely move away from the zero line after each crosses.
Limitations arise when the indicator gives these ranging signals. Ranging signals are not easy to detect because the rule is that oscillator crossing the zero line would lead to a trend movement. The oscillator may cross the zero line, but it's movement above or below may not be very great and this is not something that can be easily observed.
Also, situations may arise when the indicator would detect the trend after the trend has already gone a long way. This poses as a limitation with the use of this indicator.
Pairing Trix Indicator with EMA
The Trix indicator functions like the MACD when it (Trix) is used with an EMA. The 9EMA is used best with this indicator as it offers smoother signals than that of the MACD. Both oscillators move about the zero line, and the relative position of the oscillator to the zero line acts as a signal for analysis in the market.

As the Trix and EMA combination is similar to the the MACD, the signals given by the Trix indicator would be the same. The Trix crossing the EMA from down to up signals an increase in price in the the market.
Similarly, the Trix crossing the EMA to move downwards signals that a drop in price would occur. In this situation, a downtrend is expected and the best course of action would be to make a short entry
Let's take the image below as an illustration. At point A, the Trix indicator crossed the EMA and moved upwards. This signal was given before price began the bullish movement. The same thing is seen at point B where the Trix indicator crossed the EMA and moved downwards. The downward pull is seen late after the signal was already given by the Trix and EMA.

How the Combination of Divergences and Zero Line Cut makes the Trix Indicator Very Strong
Zero Line cuts are good forms of signals given by the Trix indicator. It is known that when the Trix crosses the zero line and moves upwards, an uptrend is expected. Also, the Trix crossing the zero line to move downwards is an indicator of a downtrend.
When a divergence is observed before the zero line cross, it is a stronger signal for the expected trend. This is illustrated in the BTC chart below. A bearish divergence, which is characterized by lower lows on the indicator and higher lows on the chart, was observed on the chart.
After this divergence, the Trix indicator crossed the zero line to move downwards. This signalled a strong bearish movement as the divergence actef as a stronger indicator than the zero line crossing. After the zero line crossing, the price of BTC against USDT began to drop and a bullish trend was observed as predicted. This shows that the combination of divergence and zero line crossing makes the Trix indicator very strong and effective.

"Is it necessary to pair another indicator for this indicator to work better as a filter and help eliminate false signals?"
The simple answer is YES. It is very necessary to pair the Trix indicator with another indicator for more accurate signals.
Let's take the RSI indicator for instance. The image below shows the same BTC chart where the zero line crossing was combined with divergence for more accurate analysis. We can notice an overbought signal was given before the divergence began. This overbought signal already indicated a change in the trend long before every other signal.
An oversold signal was also observed long before the bearish movement ended to begin a new bullish movement. This acted as an early signal for the bearish movement as it occured before the zero line crossing and before the crossing between the Trix and EMA.

Advantages of Trix Indicator
The Trix indicator gives more accurate signals than a normal EMA indicator. This is because it combines the averages of three EMAs to give smoother signals.
The indicator is not affected by price changes that do not greatly affect the trend.
The indicator is very effective in detecting trend reversals especially when combined with the EMA.
Divergences can be detected with this indicator, making it more effective in detecting trend reversals.
<Disadvantages of Trix Indicator
As a leading indicator, the Trix experiences some lags in the price of an asset. This is because the Trix is based on the Exponential Moving Averages which delay in giving signals.
The Trix is a disadvantage when used without the combination of other indicators and techniques.
Conclusion
The Trix indicator is an oscillator that moves about a line called the zero line. This indicator is effective for detecting trend reversals and this is possible because it combines three EMAs that make it less affected to minor price changes in the market.
We've seen how to configure the Trix, how to combine it with the EMA, and how to use the indicator with the RSI indicator. This indicator has proven to be very effective for market analysis, and it would allow for more profitable trades.
Finally, it is best to combine this indicator with other indicators or/and technical analysis techniques to get the best out of it.
Cc: @kouba01
hello, is this account on another platform yours?
https://peakd.com/@uchescrib02/posts