Trend Reversal - Crypto Academy / S5W3- Homework Post for @reminiscence01

This homework task is focused mainly on trend reversals, how to identify them, and how to utilize these situations for maximum profit.
Trend Reversal
In the world of cryptocurrencies, there are two types of trends namely: Uptrend or Bullish Trend and Downtrend or Bearish Trend. An uptrend is a situation in the crypto market where the price of an asset is relatively increasing. The cause of price movement upward is as a result of buyers taking over the market (purchasing the asset in large numbers). Large number of purchase of the asset increases its value, which increases the price of the asset.
A Downtrend on the other hand, is a situation where the price of a crypto asset is going down because of the effects of investors in the market that sell off the asset. As more investors sell the asset, it's value drops which causes a relative drop in the price of the asset.
A cryptocurrency can never remain in a particular trend. A trend reversal is a situation whereby a change in the trend of a cryptocurrency is observed in the market. Trend reversals occur because of the weakness of an already existing trend.
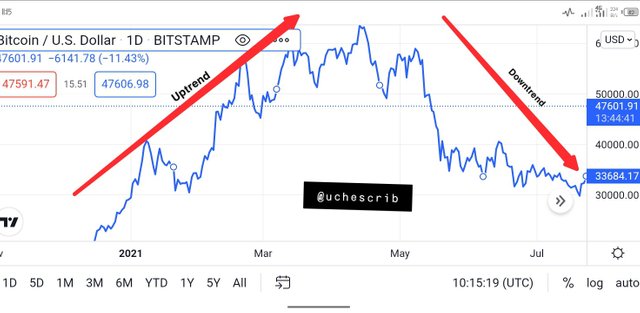
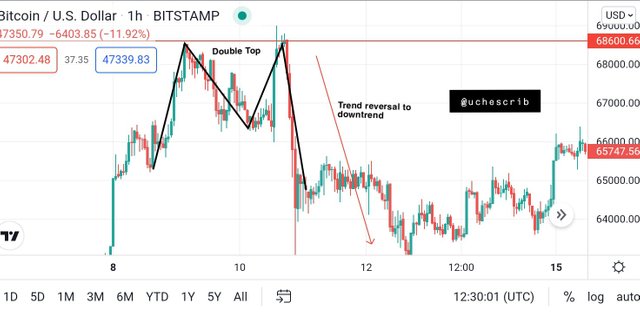
The image below shows the reversal of the trend of Bitcoin from an uptrend to a downtrend.
It is important for traders to be able to detect trend reversals because:
It makes it possible to detect good entry and exit points.
It will help the traders in maximizing profit.
It prevents loss.
It will help the traders to make good decisions in price analysis and trading.

How Fake Signals can be Avoided in the Market
Traders make use of the ability to detect signals in the market to make good entry and exit points. The ability to read these signals is what enables traders in making large profits from their trades.
But sometimes, the signals that the market gives off may be misleading. These fake signals can lead to little or massive losses in the market.
To avoid fake signals, it is necessary for traders to use technical indicators in technical analysis. Technical indicators are useful tools that can be incorporated into the chart to improve the analysis of the chart. It helps traders to make decisions in the market.
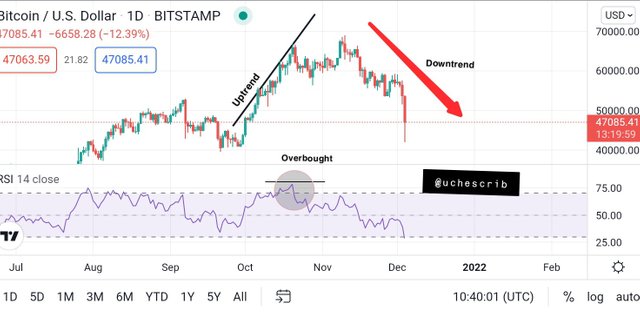
Relying only on patterns from the price chart is a bad strategy as a trader. The image below gives an instance where a technical indicator can be utilized to avoid faked signals. The BTC chart was in an uptrend and there were no signs of a possible reversal using patterns, but the RSI indicator showed that the price had reach the overbought region. This signalled that a trend reversal would occur, and that is the current situation of the market
To avoided fake signals, it is also important for every trader to use the stop loss order in their trading strategy.
What is a Stop Loss Order?
A stop loss order is a mechanism that is used to automatically trigger a buy or sell order if the price movement in the market does not follow the predicted pattern. This mechanism helps in minimizing losses.
Break of Market Structure
The market structure of a trend defines the specific patterns that the price make during a particular trend. In a bullish trend, it is known that the price of an asset always forms higher highs than the previous high points, and higher lows than the previous low points. With every little retracement in price, the next high and low points must always be higher than the previous.
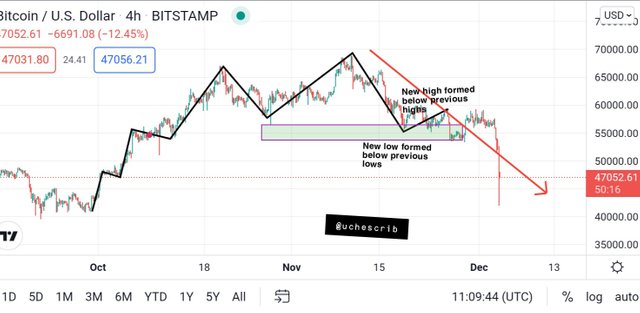
During a trend reversal, this rule is broken. A trend reversal of a bullish trend can be indicated by a break in the market structure as the newly formed high and low points would form below the previous high and low point levels. This is illustrated in the image below.
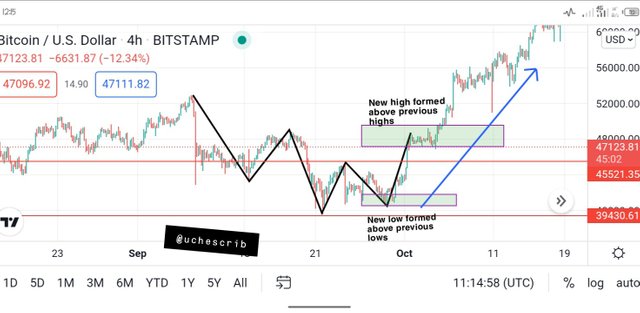
In a bearish trend, it is known that the newly formed high and low points must fall below the previous high and low points for the trend to continue. In the case of a reversal, this rule is broken so that the newly formed high and low points are formed above the previous points. It is illustrated in the image below.
Break of Trend Line
A trend line is used for defining a trend. A trend line acts as dynamic support and resistance for price depending on the market situation.
In an uptrend, the price of the asset respects the trend line as it serves as dynamic support. A trend reversal is signalled as the price breaks below the trend line, causing the beginning of a bearish market. This can be seen in the image below.
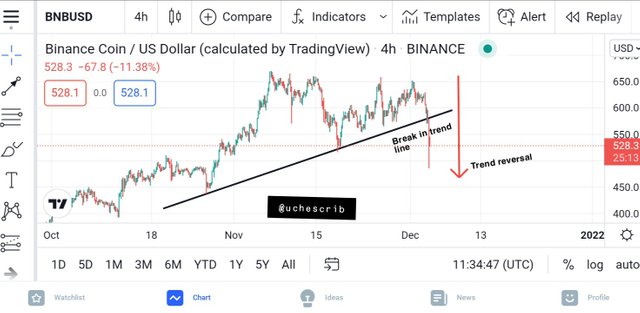
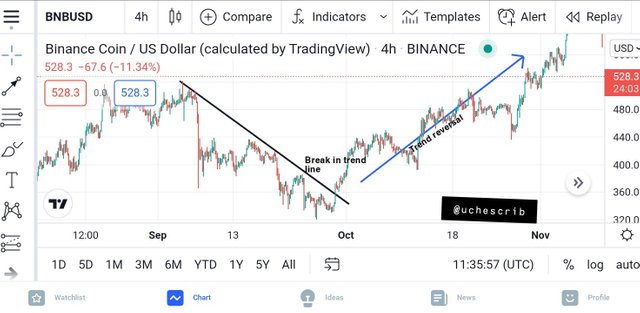
On the other hand, the trend line functions as a dynamic resistance for price in a downtrend. Price respects thus resistance as it keeps going down. A trend reversal is signalled as price breaks the trend line to begin movement upwards. This signals a bullish market and it can be seen in the image below.
Divergence
A divergence is a situation in the market in which the price chart shows the movement of price in a particular direction, whereas the indicator moves in the opposite direction. Divergence is a signal for trend reversal in the crypto market.
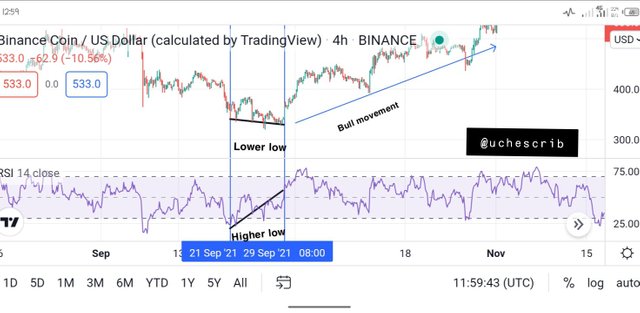
Bullish Divergence
A bullish divergence occurs when the price moves downward but the indicator moves upward. A bullish divergence occurs in a bear market and it signals a reversal of the bear market to an uptrend. This situation is illustrated in the image below.
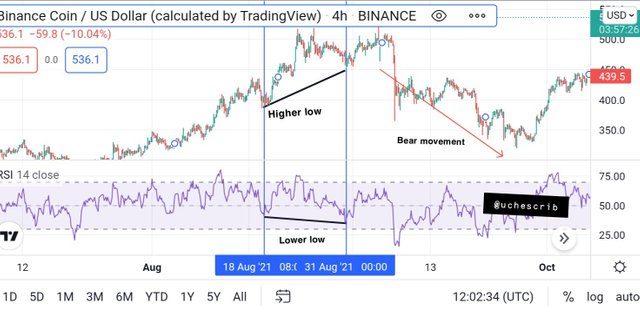
Bearish Divergence
A bearish divergence occurs when the price movement of the market is in an upward movement but the indicator moves downwards. This situation is used to signal that the current bull market would experience a reversal and therefore, the market would become bearish. This can be seen in the image below.
Double Top and Double Bottom
Double Top
For an uptrend to continue, the price must keep making higher highs and lows with each retracement. A double tip is a situation that occurs when the price of an asset does not form a new high after a retracement, but it retests the previous high point before moving downwards. The double top is a signal that indicates the reversal of an uptrend to a downtrend and it is caused by the weakness of buyers in keeping the price up. The image below shows the double top pattern in a real situation.
Double Bottom
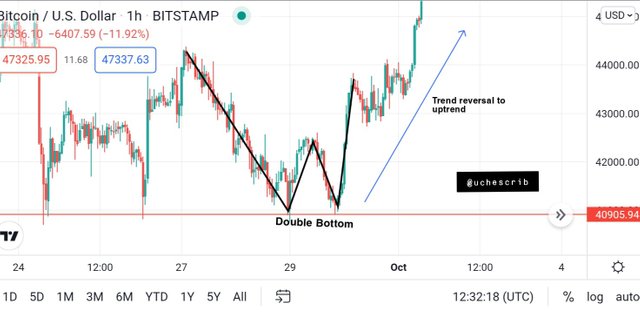
For a downtrend to continue, price must form lower highs and lows with each retracement. A double bottom is formed as the price fails to form a lower low point, but price retests the previous low point before the movement shifts upwards. The double bottom is a signal that indicates the reversal of a downtrend to an uptrend and it is caused by the failure of sellers in keeping the price down.
Demo Trade on BNBUSDT Market Using Trend Continuation / Reversal Pattern
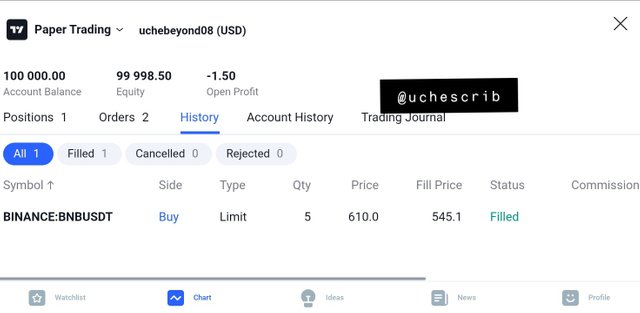
At the early hours of November 30, the price chart experienced a retracement in its price. As the price began going up again to form a new high, I placed a trade at exactly 6:03am at the price of 610USDT.
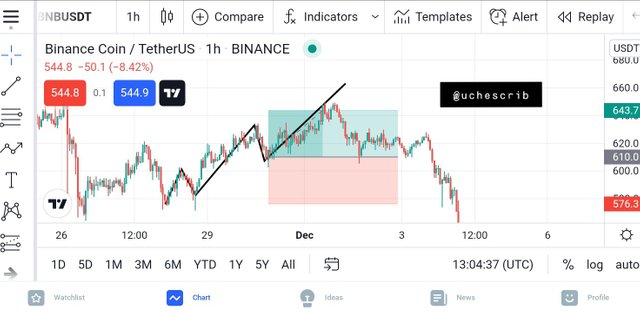
Taking into consideration the zigzag pattern of the chart which showed higher highs and higher lows with each retracement, I made a prediction that the price would form a new high.
I used the long position tool to set my stop loss at a reasonable point of 576.3USDT and used a risk-reward ratio of 1 to set my take profit point at 643.7 USDT. All these were set as I made the entry in the market.
Conclusion
Trend reversal identification techniques are very important to all crypto traders and investors. It helps in avoiding unnecessary mistakes in trading while profit is maximized.
In my opinion, it is advisable to always incorporate technical indicators for every strategy that is used for analysis in order to improve accuracy.
Special thanks to @reminiscence01.
Hello @uchescrib , I’m glad you participated in the 3rd week Season 5 of the Beginner’s class at the Steemit Crypto Academy. Your grades in this task are as follows:
Observations:
This image is incorrect for a bullish divergence. Please revisit the lesson to understand how to detect divergence properly.
Recommendation / Feedback:
Thank for participating in this homework task.