Trading with Wedge Pattern - Crypto Academy / S5W5 - Homework Post for @sachin08
Wedge Pattern
Wedge Pattern is a technical analysis method that uses a specific pattern formed on the price chart to predict future price movement, thereby creating good trading opportunities.
The wedge pattern is formed by the convergence of price which is marked by trend lines on the price chart. The convergence of the trend lines is an indicator for a trend reversal in the market. It shows that the highs and lows in the price chart are either falling or rising at a particular rate. The rate of rise and fall is diminishing, which results in the trend reversal.
The term "convergence" means that the trend lines marking the wedge pattern would have a wide opening at the initial point, and a narrow a constricted opening at the end point until they meet each other. The reversal usually occurs at the convergence point, signalling the beginning of a new trend.
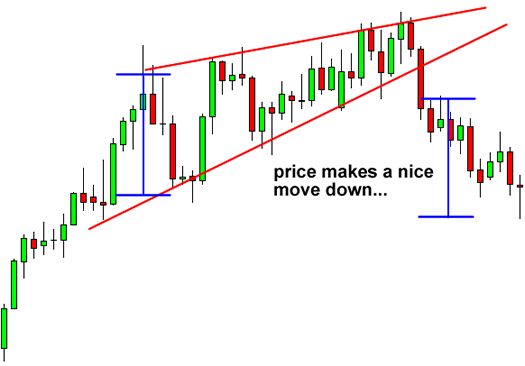
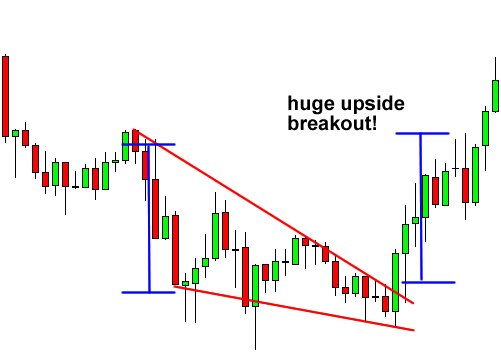
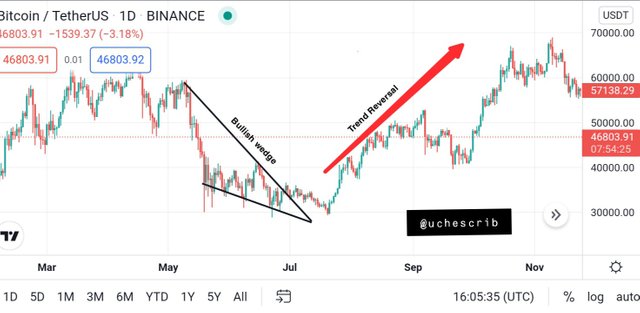
The wedge pattern indicates the end of a trend or a retracement of a trend before the continuation of that trend. Images of wedge pattern are seen below:

Types of Wedge Patterns
Wedge patterns are of two types namely:
- Rising Wedge
- Falling Wedge
Rising Wedge
The rising wedge is a wedge pattern that is identified by converging price pattern upwards in the price chart. It is also called the bearish wedge because a downtrend occurs as the trend lines converge and meet at a point.
The rising wedge is typically seen in an uptrend. As the price of an asset increases, it gets to a point where diminishing candle patterns are observed in the uptrend. A trend line is used to mark these candle sticks to determine if a convergence would be formed. Trend reversal is observed just as the two tend lines are about to meet.
A rising wedge can also be seen in a downtrend. A retracement from the downtrend can be mistaken as an uptrend to certain traders and investors. If a rising wedge is observed in this situation, it would signal a trend continuation in the downtrend. This is a confirmation of why it is called a bearish wedge regardless of whether it is formed in an uptrend, or in a retracement of a downtrend.
To successfully identify a bearish wedge, the following conditions must be met:
One trend line must be drawn along the minor highs while the other must be drawn along the minor lows. These trend lines must slope upwards and have a point where they intersect.
Both trend lines must have 5 collective minimum touches on the candlestick chart, i.e 3 at the top and 2 at the bottom, or vice versa.
The volume must trend downwards indicating weakness in the current trend.
Falling Wedge
The falling wedge is a wedge pattern marked by converging trend lines moving downward. The falling wedge is also called the bullish wedge. This is because this wedge pattern is a signal for an approaching bullish movement in the market.
This wedge pattern is typically seen in a downtrend. As the price of an asset decreases, it gets to a point where diminishing candle patterns are observed in the uptrend. A trend line is used to mark these candle sticks to determine if a convergence would be formed. Trend reversal is observed at the point of intersection of these two lines.
A falling wedge can also be seen in an uptrend. A retracement from the uptrend can be mistook for a downtrend to certain traders and investors. If a rising wedge is observed in this situation, it would signal a trend continuation in the uptrend. This also confirms the term "bullish wedge" because this situation leads to a bullish market irrespective of whether it was formed in a downtrend, or in a retracement of an uptrend.
To successfully identify a bullish wedge, the following conditions must be met:
Trend Lines must be drawn along the minor highs and lows. The trend lines must be sloping downwards and should intersect at a point.
The trend lines must have a minimum of 5 collective touches. It could be 3 on one side and 2 on another. The trend lines must touch all the minor highs and lows, forming a dynamic support at the bottom and dynamic resistance at the top.
The volume must trend downwards indicating weakness in the current trend.
Does the Breakout of these Wedge Patterns produce False Signals sometimes?
False signals are not unknown or peculiar phenomena in the world of crypto trading. It is a situation in which technical analysis of the market gives a particular signal, but the price chart undergoes the opposite.
The wedge pattern can give off false signals. This is typical of all methods of technical analysis that involve identification of patterns on the price chart and also the use of technical indicators. False signals of the wedge pattern is such that a bullish wedge can eventually lead to a bearish market, and a bearish wedge leading to bullish market.
To filter false signals in any indicator or applied method of technical analysis, it is important that more than one technical indicators should be used. The use of multiple technical indicators would help traders and investors to see a clearer picture of the market situation, which would lead to better decision making.
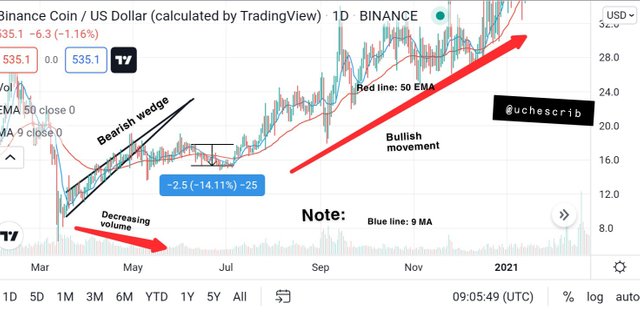
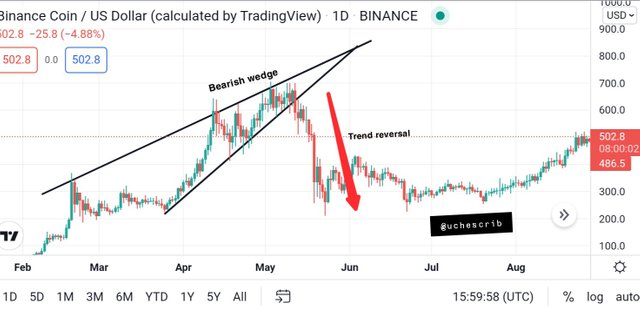
The image above is an illustration of the wedge pattern giving a false signal. It can be seen that the bearish wedge was observed in the price chart and the volume is decreasing. I brought in the 50 EMA and 9 MA for confirmation of the possible bear movement.
At the point of intersection, the market seems to undergo a bear movement. Even the moving averages have crossed the candlestick and are formed above the chart. All these indicated a bearish movement.
Using the 50 EMA, it is known that a large distance between the indicator and the price chart indicates a strong trend. In the illustration, the distance between the indicator and the price chart is very little. The strength of the trend is not strong at this point. This means that this little downward slope will not last.
After a few candlesticks, the price continued in it's upward movement. If an entry was made at the point of intersection, the trader would've made a loss. It can also be seen that there was a 14% price change from when the price dropped till the beginning of the uptrend. Even if a trader was able to exit the trade before the uptrend, the profit is negligible and thus the trade is not successful.
Trade Setup using Wedge Patterns
Bullish Wedge
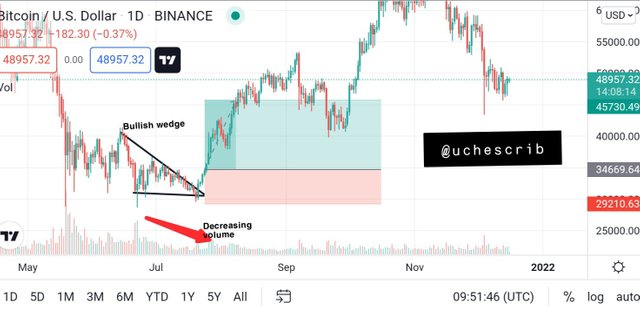
The diagram below shows a setup of trade strategy using bullish wedge. We notice that the trend lines drawn at both points are converging downwards and eventually met at a point. The volume was also decreasing which shows a good bullish wedge pattern.
The buy entry is made at the time of intersection between the two points. The entry is at the closing price of the candle at that point in time. Setting my stop loss at 15.75% from my entry, I used a risk-reward ratio of 2.03 to set my stop loss at a point 31.90% above the entry point.
- Entry: 34669.64 (+31.90%)
- Take profit: 45730.49
- Stop loss: 29210.63 (-15.75%)
Bearish Wedge
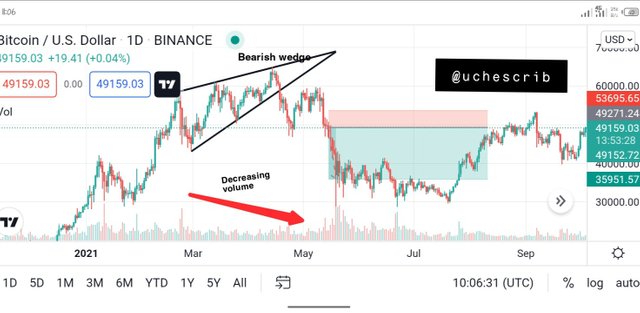
The diagram below is a trade strategy setup using the bearish wedge pattern. It is observed that the converging trend line sloping upwards eventually intersected at a point. The volume was also decreasing, which is a good indication of a bearish wedge.
The sell entry was made at the time of intersection between the two trend lines. The entry was made at the opening price of the candle at the time of the intersection. My stop loss is set at 8.98% above the entry point. Using a risk-reward ratio of 3.01, I set my take profit point at 27.03% below the entry point. I used a large risk-reward ratio because the loss I would incur at the stop loss is little in comparison to the profit I would make.
- Entry: 49271.24
- Take profit: 35951.57 (+27.03%)
- Stop loss: 53695.65 (-8.98%)
Conclusion
The wedge pattern is a very effective method of technical analysis using pattern identification. It can be used to make large profits with good market predictions. The wedge pattern is just one out of the many pattern analysis techniques in crypto trading. It would be more beneficial for investors to also utilize other techniques.
The wedge pattern has also been proven to give false signals sometimes. To avoid this, it is best to combine this technique with technical indicators to further confirm signals given by the wedge pattern technique.
I have attempted all the task and would end this post on the note that all technical analysis techniques are prone to errors. Because of this, combining techniques in market analysis is required to yield the best rewards from crypto trading.
Cc: @sachin08