Support and Resistance Breakouts - Crypto Academy / S6W3 - Homework post for pelon53

Greetings everyone. Joining the 3rd week of Crypto Academy Season 6 is an honour. The professor gave lessons on the breakouts from support and resistance levels and how to apply trading techniques in the various situations that a trader can be faced with due to these breakouts. Without any waste of time, I would handle the tasks given by the professor.

Support and Resistance
Support is a region marked on the price chart that the price of an asset does not fall below for a particular period of time.
Resistance is region marked on the price chart that the price of an asset does not rise above for a particular period of time.
Both support and resistance are important in crypto trading. They can act as entry points and stop loss regions. The breaking of these regions by price could greatly signal a change in trend of price action.
Advantages of Locating Support and Resistance
Locating areas of support and resistance on the chart before/during trading would give a clearer picture of the market situation at a given time. Support and resistance levels help predict the next trend more easily without the implementation of technical indicators in the chart.
Areas of support and resistance are located to boost the accuracy of technical analysis techniques. The use of a combination of indicators is necessary for profitable trades. When support and resistance areas are taken into consideration in trading, analysis become more accurate and trades can be executed with better knowledge of the market situation.
As better trades are made with these support and resistance levels, it means that risks would be highly managed. The best trades are made with good risk management techniques. Support and resistance levels make it easy for a trader to utilize a good risk management technique because a clearer picture of the market is observed.
Breakouts of Support and Resistance
The crypto market consists of two trend which are the uptrend and downtrend. Uptrend is when the price is going up for a given period of time, while downtrend is when the price falls at a given period.
What of a situation where an uptrend or a downtrend is not defined? This is known as a ranging market, and it is characterized by upward and downward movement of price within an upper boundary (resistance) and a lower boundary (support).
When the price goes above the upper boundary, it is known as a resistance breakout. On the other hand, price going below the lower boundary is known as a support breakout.
Support and resistance levels are good regions for making entries and setting stop losses. They are very good tools that a trader can use to apply good risk management.
Breakout of Resistance
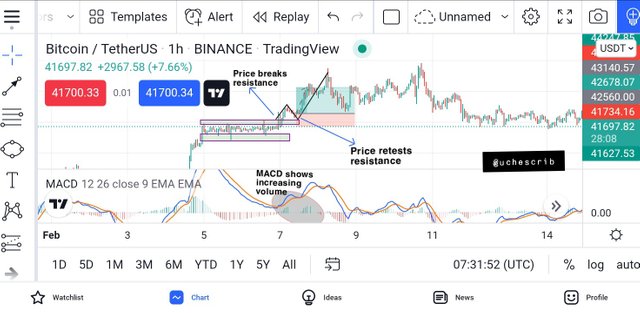
A breakout of resistance usually leads to an uptrend. As the price breaks the resistance level, we wait for the price to retest the resistance level once more.
As the price retests the resistance level, the next candle formed should be a bullish candle. It should be noted that the pullback of price as it retest the resistance level is as a result of the trend gaining momentum to become fully formed.
Entry should be made at the second candle formed after price retests the resistance level. Stop loss should be placed below the resistance level for good risk management.
The MACD indicator was used to filter the signals given by this technique. On this indicator, the volume is seen to be moving upwards as price breaks the resistance. This signifies a bullish movement. Also the MACD line and signal line were both rising above the zero line, also indicating a bullish movement.
It should be noted that sometimes price crosses the resistance during the retest. This situation would lead to a bearish movement as opposed to the expected uptrend. It is for this reason that we wait for the second candle formed after the retests before making an entry.
Support Breakout
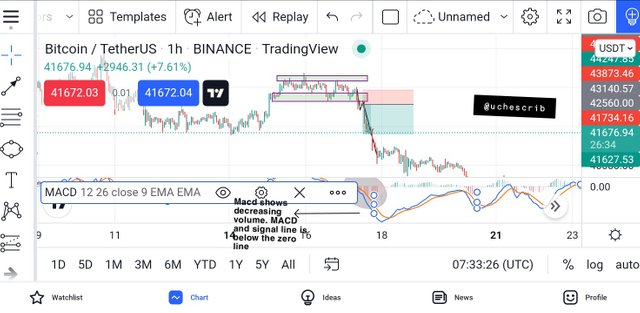
A breakout of support usually leads to a downtrend. Price breaks the support and observes a pull back before the downtrend is fully observed.
As price retests the support region, the next candle formed should be bearish. The price retests the support in order to gain momentum for the bearish movement. Therefore, a bearish candle is expected after the retest.
Entry should be made at the second candle after the retest. The stop loss should be placed above the support region and a risk reward ratio of 1:2 for an optimum risk management.
The MACD indicator was implemented into this chart to filter the signals given with this technique. The MACD line and signal line was observed moving below the zero line, with high selling volumes. This confirmed the downtrend formed by the breakout.
It should be noted that a downtrend is not always formed during breakout. In some scenarios, price crosses the support region during the retest of the region. This would lead to a bullish movement as opposed to the expected downtrend.
False Breakouts
It is known that after a breakout, a retest is observed for the trend to gain momentum before the trend fully continues. But there are situations when this is not the case.
A false breakout is observed when a pull back does not form a retest, instead it breaks above or below the support or resistance.
In the case of a breakout from a resistance, a pull back would be formed with the price reaching the resistance level again. Instead of price to bounce off the resistance level, it instead crosses the level and moves downward to form a bearish movement.
In the case of a breakout from a support, a pullback would be formed with the price reaching the support level again. Instead of price to bounce of this level and form a bullish pull, it instead crosses the level and moves upward to form a bearish movement.
These breakouts can lead to profitless trades if care is not taken care. To avoid making losses on trades with false breakouts, the entry should be made after the candle formed after the retest. Technical indicators should also be used to confirm the direction of price after the breakout.
Also, the volatility of price of the asset and past pattern movement of the asset should be taken into consideration before decision making. Most importantly, always have a stop loss with every trade using this method and every other method.
Demo Trade on Resistance Breakout
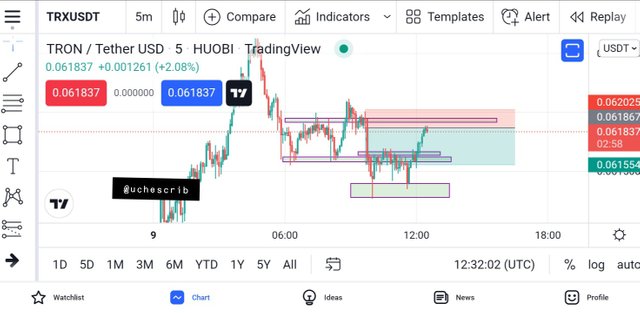
The 5min TRXUSDT chart showed a sideways movement as a trend was not defined. Price then crossed the resistance, signifying a possible change in trend.
A pull back is observed after price crossed the resistance. The price did not rebound after retesting the resistance, but instead crosses the resistance level to begin a downtrend.
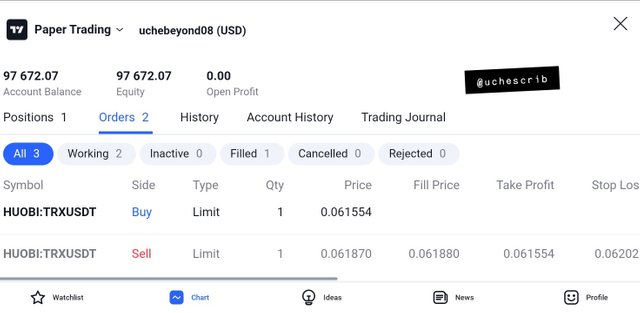
I made my entry at the long bearish candle at a price of 0.06187 and my stop loss and take profit points at 0.062025 and 0.061554 respectively.
Demo Trade on Support Breakout
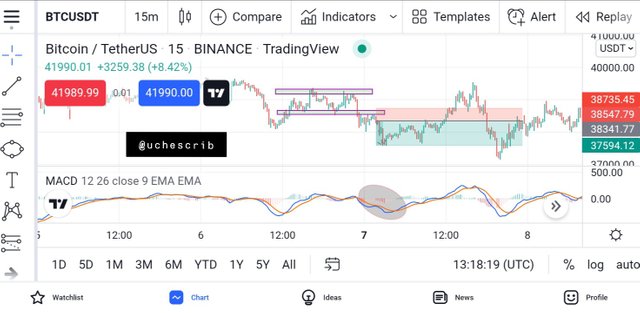
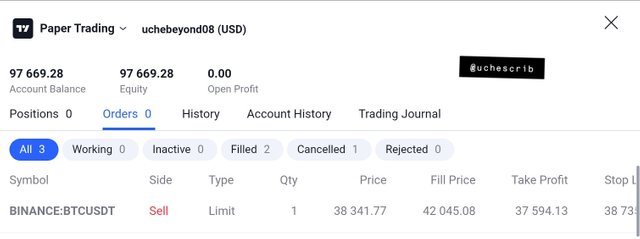
The 15min BTC chart showed a sideways movement of trend for a while. Price then crosses the support and moves downwards.
A pull back is observed and price retests the support region before continuing the downtrend. With this data, I made my entry at 38341.77 and set my take profit and stop loss points at 37594.13 and 38735.45 respectively.
Conclusion
Trading involves the identification of patterns in price movement, and using this knowledge to make entries and exits in a market for profit. Support and resistance breakouts are useful because they signal a strong bullish or bearish movement.
Knowing how to identify these breakouts and the false breakouts would make for more profitable trades. Also, combination of this technique with other techniques would further improve the profits of trades.
Cc: @pelon53