[Price Bars and How to Read Them] - Crypto Academy / S5W8 - Homework Post for @sachin08

Greetings to everyone on this platform. It is an honour to be a part of the final week of Crypto Academy Season 5. This week, the professor covered price bars and how to identify specific patterns for good trading decisions. Given the knowledge, I would handle the tasks given by the professor.
Price Bars and How to Add Them to the Chart
Price bars are technical analysis tools in the chart that enables traders and investors to read specific information on an asset in a given time. They make it possible to be able to tell the current market situation by giving patterns that can be interpreted by investors.
Price bars are utilized in detecting the current trend of a market. Trend reversals and indecisiveness in the market can also be detected with the price bars.
To add the price bar to a chart on TradingView:
Select the candle icon.
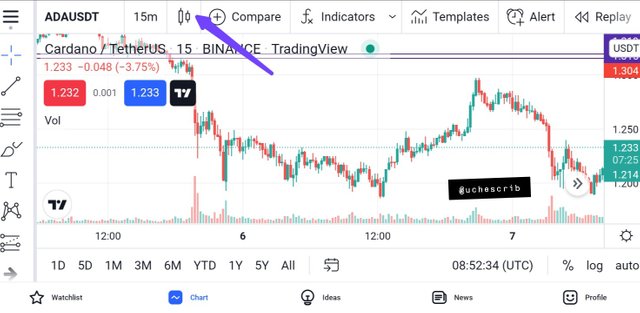
Select "Bars".
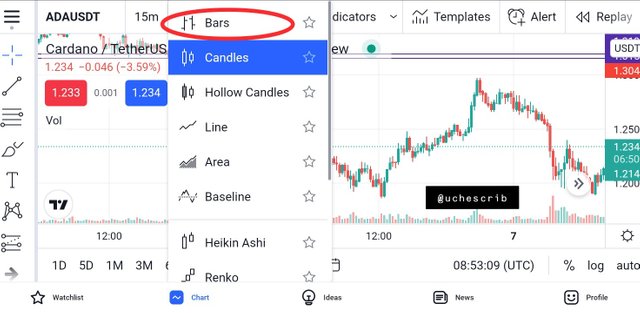
The price bar has been successful added to the chart.
The price bar consists of the following parts:
Open: This is the horizontal line at the left side of the price bar. It indicates the price at which the asset started trading for the day.
Close: This is the horizontal line at the right side of the price bar. It indicates the last price at which the asset traded for the day.
Low: This is the lowest point of the price bar. It indicates the lowest price the asset reached in the trading period.
High: This is the highest point of the price bar. It indicates the highest price the asset reached in the trading period.
.png)
Identifying Trends with Price Bars
Like I mentioned earlier, the price bars can be used to identify the current trend of a market. Certain patterns observed by the price bar act as indicators for a trend.
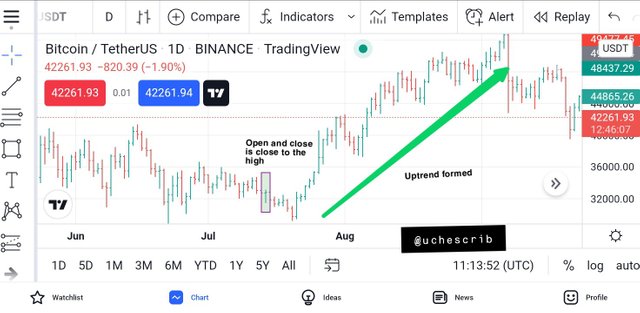
Identifying an Uptrend
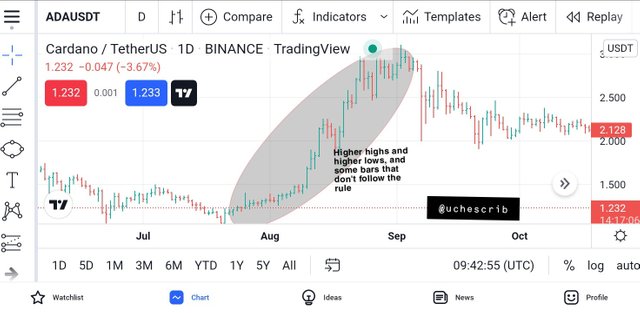
An uptrend in the market is marked by higher highs and higher lows formed by the price bars. This means that the high and low formed by a bar would be higher than the high and low formed by the preceding bar.
An uptrend would not be marked by higher highs every day during the trend. Some bars may form lower highs during the trend. This is a normal occurrence in a trend.
The best method is to identify higher lows in price bars that are formed in the trend. A pattern that is indicated by a majority of higher lows is a very good indicator of and uptrend.
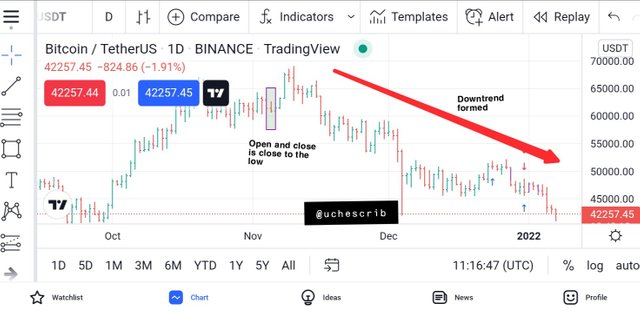
Identifying a Downtrend
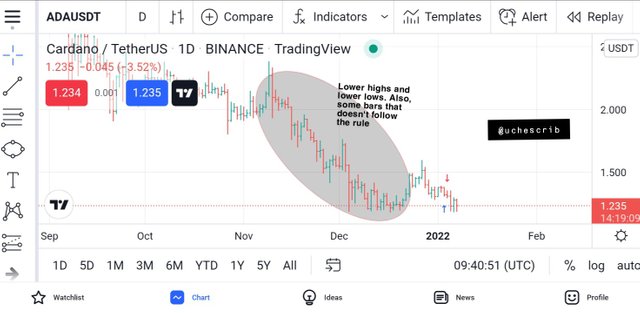
A downtrend is marked by the formation of lower highs and lower lows by the price bars. This simply means that the highs and lows of a candle must be lower than the highs and lows of the preceding candle.
It is often observed that some bars would not form lower highs and lows in the formation of a downtrend pattern. This a normal behavior of some bars in a trend.
The best method for identifying a downtrend is to observe lower highs formed by price bars. This shows weakness in market to create new highs as selling pressure increases. A pattern marked by lower highs is a good indicator of a downtrend.
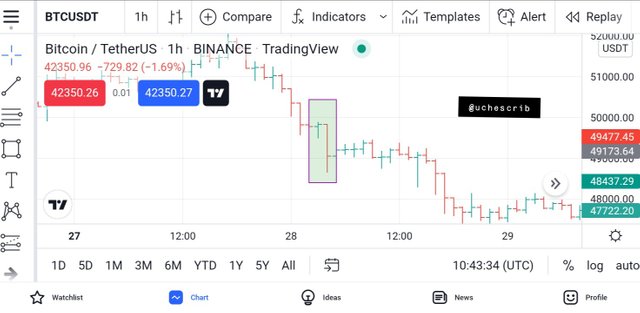
Bar Combinations for Spending the Day Inside
An inside day pattern is a bar that has its high below the high of the preceding candle and it's low above the low of the preceding candle. An inside day pattern does not indicate a definite signal in the market. It signifies indecisiveness in the market and can also be a sign that there is a general shift in thought about the asset.
In an Uptrend
The inside day pattern would be a bar with lower high and higher low after a preceding bar. It shows indecisiveness in the current trading period and can mean that traders and investors are generally shifting their interest from the asset.
In a Downtrend
The inside day pattern would still be a bar with lower high and higher low after a preceding bar. It shows indecisiveness in the current trading period in the downtrend and can mean that traders and buyers are generally shifting interest from the selling pressure of the asset.
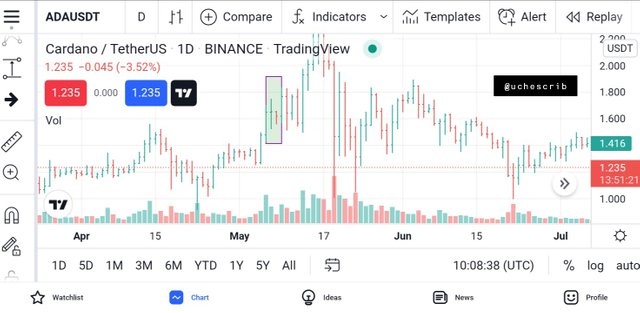
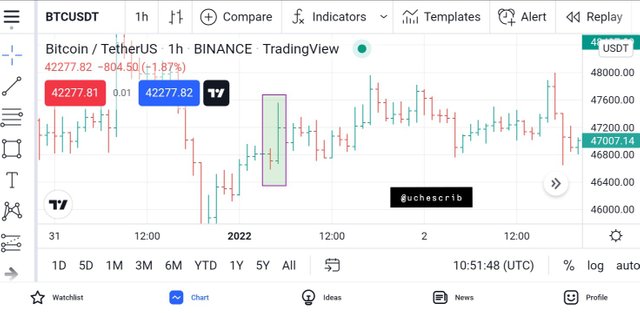
Getting Outside for the Day
This is a situation whereby the high-low range of a bar is greater than the high-low range of the previous bars. This indicates a strong movement in a particular direction which is determined by the colour of the bar with the greater high-low range.
Uptrend
A situation where the open of a bar is at the low and the close is at the high signifies a strong bullish moves. This is an indicator that should be taken seriously as the shape of this bar indicates the pressure of buyers in the market.
If the bar has a higher high and a higher low, it signals a continuation in the uptrend. On the other hand, if the bar has a lower low, it signals a reversal in the uptrend.
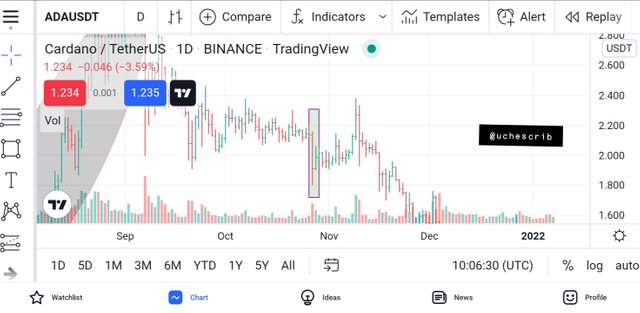
Downtrend
A situation whereby the open is at the low and the close is at the high is a strong signal for a bearish trend. The shape of this bar indicates the selling pressure in the market.
If the bar has a lower high and a lower low, it indicates a continuation of the downtrend. On the other hand, observation of a higher high signals a reversal of the downtrend.
Finding the Close at the Open
There are situations when the open and close of the price bar are at the same level or close to each other. This implies general indecisiveness in the market. If the open and close are closer to the high, it signals a trend continuation in an uptrend and a trend reversal in a downtrend.
On the other hand, a trend reversal would be observed in an uptrend and a trend continuation would be observed in a downtrend if the open and close are closer to the low of the price bar. This means that the relative position of the open and close on the price bar would determine the market situation with the use of this pattern.
Conclusion
The price bar is very effective in technical analysis. Practice with this tool would be an essential addition to a traders arsenal of techniques.
Patterns given by the price bar act as signals for different market situations. As a result of this, the price bar should be thoroughly studied and put into practice to improve a traders conversance with the techniques.
Finally, the price bar should be combined with other technical indicators to improve the chances of profiting from the crypto market.
Cc: @sachin08