Introduction to Market Trends - Crypto Academy / S5W1- Homework Post for @reminiscence01

Trending Market
Trending Market refers to the representation of the forces of demand and supply which affect the movement of price of cryptocurrencies in a particular direction. The presence of buyers and sellers in a market affects the movement of price upwards, downwards or in a range.
A trend is said to be defined when there's a clear movement of price either upwards or downwards. This is what is meant by a trending market.
Bullish Trend
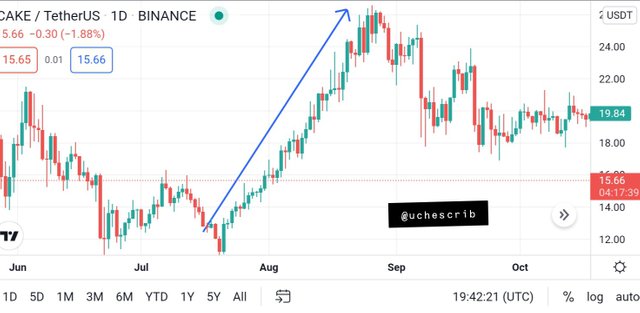
A bullish trend is simply the defined movement of price upwards. Bullish trend is observed when price movement makes higher highs and higher lows than the previous highs and lows respectively.
A bullish trend occurs as a result of buying pressure on the market. This means that more investors are purchasing the asset, causing the price to keep increasing.
Retracements in a bullish market always form higher points than the previous points. This is a clear signal that the trend of a market in such situation is bullish.
Bearish Trend
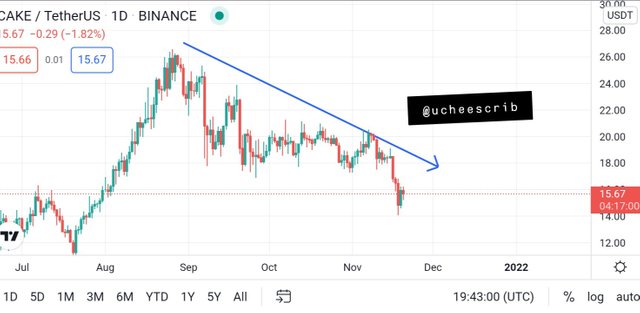
A bearish trend is seen as the defined movement of price downwards. Bearish trend is observed when price movement makes lower highs and lower lows than the previous highs and lows respectively.
A bearish trend occurs as a result of selling pressure on the market. This means that more investors are selling out the asset, which causes the price to keep going down.
Retracements in a bearish market always form lower points than the previous points. This is a clear signal that the trend of a market in such situation is bearish.
Market Structure
Uptrend
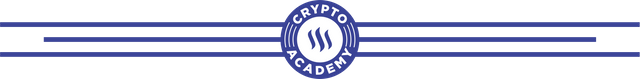
A trend is always characterized by retracements. These retracements would determine the direction of the current trend. In an Uptrend, the retracements always form higher high points and low points than the previous highs and lows.
This is as a result of buying pressure in the market. The large accumulation of buy orders is what pushes the movement of price upwards.
Downtrend
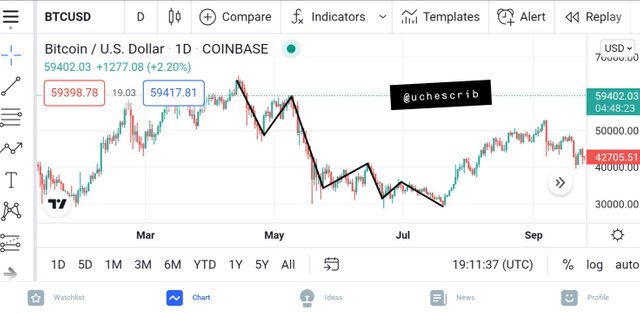
A downtrend is characterized by retracements which form lower highs and lows than the previous highs and lows respectively. The retracements would create a zigzag movement in price which would have a downward movement.
A downtrend is formed as result of great selling pressure in the market. As more investors sell of their assets, the price of the market tends to go lower and lower till a reversal is observed.
Understanding of the market structure of the two trends (bullish and bearish) would help an investor to make good entries and exits in a crypto market.
Trend Lines
A trend line is a tool used to trace the path of a trending market. The trend line can be drawn with as little as two swing points.
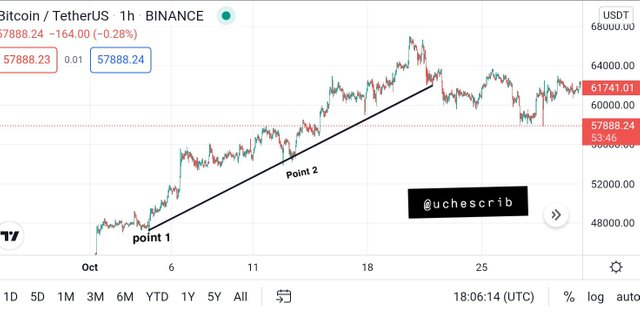
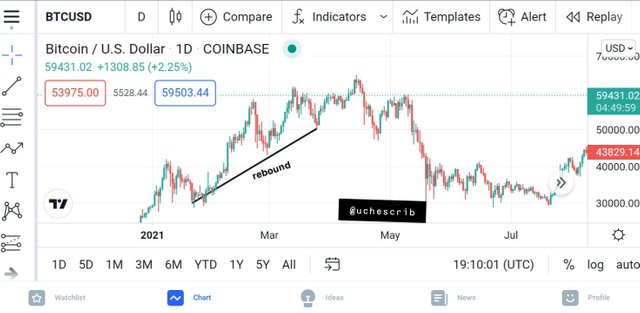
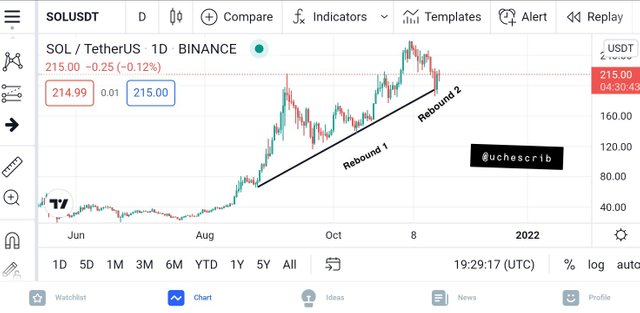
In a bullish market, price moves above the trend line. There are periodic moments when price touches the trend line before rebounding to continue the trend. These points can be used as good entry points. It is illustrated in the chart below:
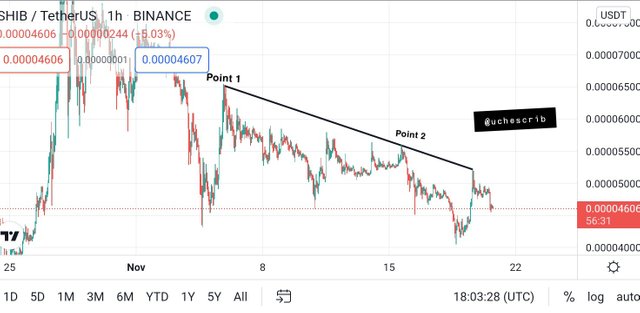
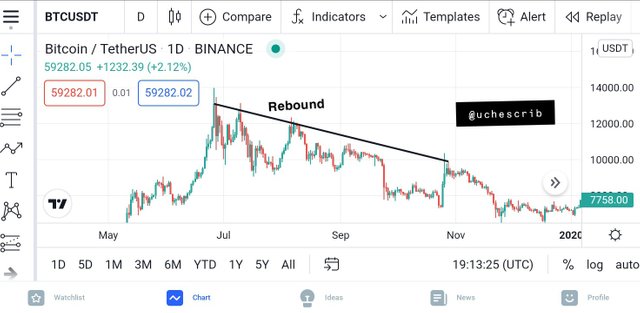
In a bearish market, the price moves below the trend line. Periodic rebounds occur as price touches the trend line from time to time before the trend continues in its downward movement. These points can also be used as good entry points in the bearish market. It is illustrated in the chart below:
Spotting Trend Continuations using Market Structure and Trend Lines
A bullish trend is characterized by upward movements. It is known that this upward movement is not a straight line but a zigzag pattern. The zigzag pattern forms new highs and lows as the price of the asset moves upwards.
In this zigzag pattern, higher highs and higher lows are formed with every new pattern. This signifies the continuation of an uptrend.
Using the trend line, an uptrend is defined by movement of price above the trend line and rebounds as the price touches the trend line.
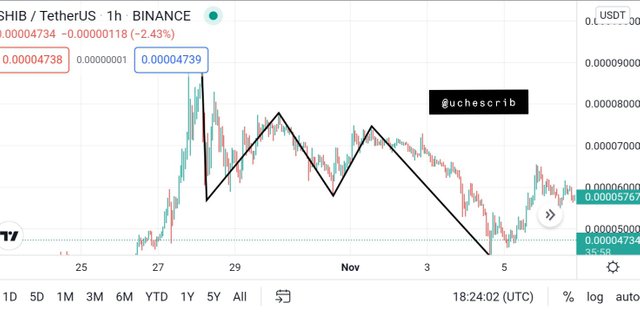
A bearish trend on the other hand is characterized by downward movement of price. The movement of price is a zigzag pattern which has high and low points, with a current high and low being lower than the previous.
A bearish movement is characterized by lower highs and lower lows with every movement. This signifies the continuation of the downtrend.
Using the trend line, a downtrend is defined by movement of price below the trend line and rebounds as the price touches the trend line.
Analysis of SOLUSDT
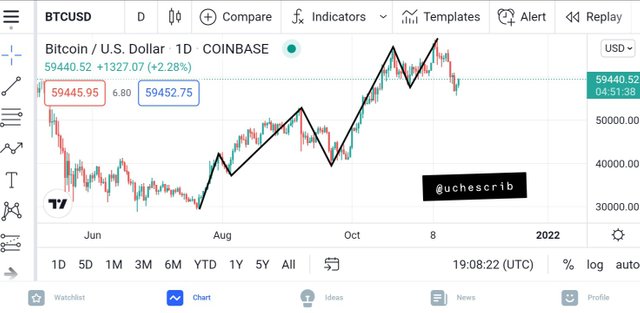
First of all, the chart for SOLUSDT shows an upward zigzag movement of price which signifies a bullish trend. Notice how the pattern forms a higher high and higher low when compared to the previous high and low points.
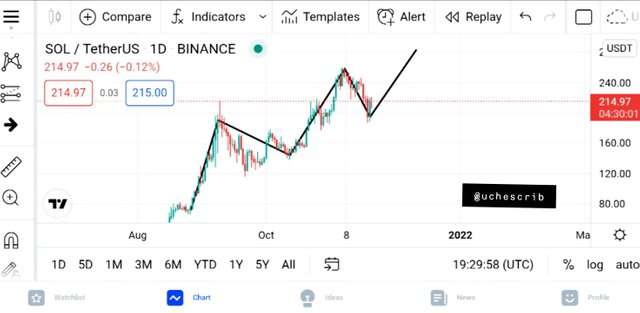
On introduction of the trend line, it is observed that the price had made a rebound sometime in the past to continue the uptrend. A second rebound is observed later, signifying the continuation of the trend. In final words, the SOLUSDT chart is in an uptrend.
Conclusion
A trending market is basically defined by the relative position of current high and low points to the previous high and low points. Understanding of trends would enable investors to make good decisions in crypto trading.
On a different note, the use of technical indicators is also necessary for trend identification. I believe that this would be discussed in due time.
Thanks for reading.
Cc: @reminiscence01
Hello @uchescrib , I’m glad you participated in the 1st week Season 5 of the Beginner’s class at the Steemit Crypto Academy. Your grades in this task are as follows:
Recommendation / Feedback:
Thank you for participating in this homework task.
Thank you prof. If I may ask, please how can I improve on my writing skills?
Also how can I make I chart analysis more presentable?