Crypto Academy Week 16 - Homework Post for @kouba01
Bollinger Bands Indicator
The Bollinger Bands indicator was developed in the 1980s by John Bollinger. It is an oscillating indicator which means that it is used in determining overbought and oversold situations in a market. It is also used to determine trend directions a the volalitily in a market. Support and resistance levels can also be determined with this indicator.
Calculation Method
The Bollinger Bands indicator consists of 3 lines; the upper line, the lower line, and the Moving Average (middle line).
The Moving Average is simply the average price of the market over a period of days. By default, the Bollinger Bands indicator is set to 20-Moving Average.
Where "x" is the number of days,
Moving Average = Sum of prices for x days/x
By default, the upper and lower bands are each two (2) standard deviations.
The upper line is 2 standard deviations added to the 20-Moving Averages.
The lower line is 2 standard deviations subtracted from the 20-Moving Average.
Note:
- 1.5 standard deviations are used for a 10-day Moving Average
- 2 standard deviations are used for a 20-day Moving Average
- 2.5 standard deviations are used for a 50-day Moving Average

Bollinger Bands Set-up
I will illustrate how to open the Bollinger Bands indicator in TradingView for Android.
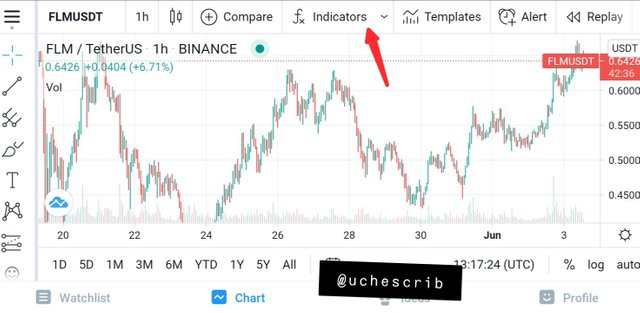
Select fx indicators.
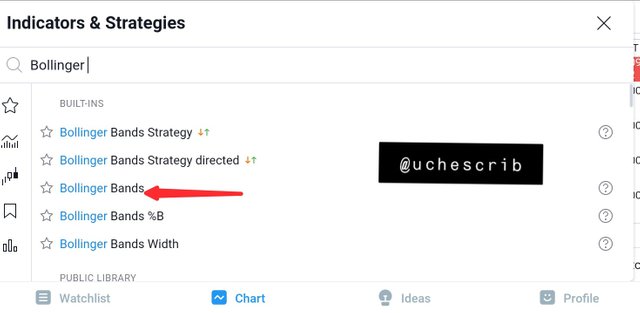
Type "Bollinger" in the search bar. Select Bollinger Bands.
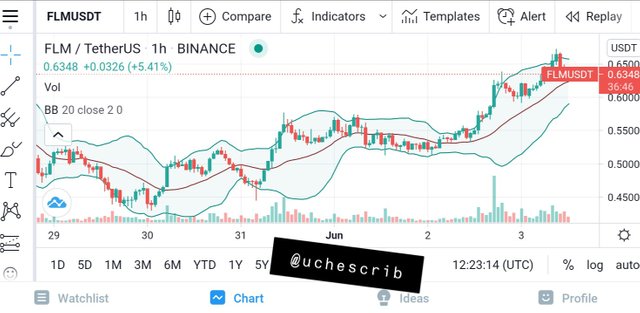
The indicator would be displayed on the price chart.
Indicator settings.
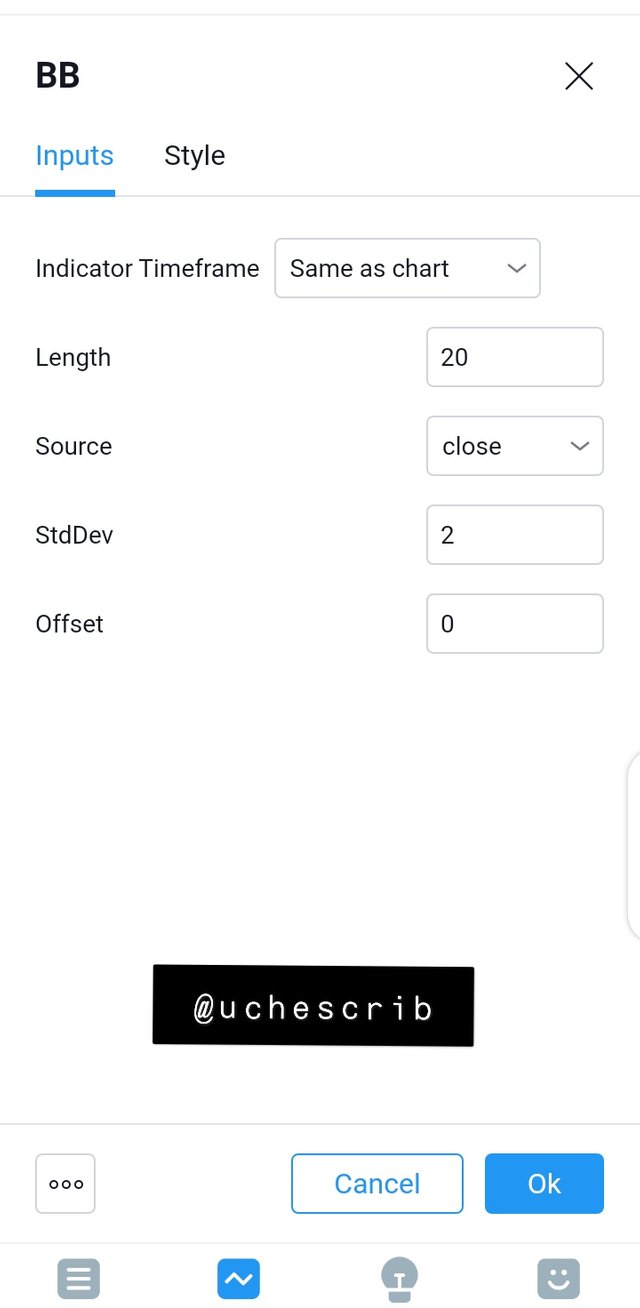
Length: This is the value of the Moving Average
Indicator timeframe: Time frame of the indicator is best set as "same as chart"
Source: This is the basis of the indicator, which is the closing price by default.
StdDev: This is the standard deviation of the upper and lower bands
Offset: This takes the candlesticks after the chart into consideration.
How to determine a Breakout.
In a regular candlestick charts, levels of support and resistance are continuously formed. These are levels that price cannot go beyond, either up or down.
A breakout is a situation when price movement breaks a level of support or resistance. A breakout is accompanied by a trend reversal.
A breakout is determined with the Bollinger Bands indicator when a candlestick forms outside the upper or lower band. A breakout signifies a bullish trend or bearish trendy, depending in the direction of the breakout.
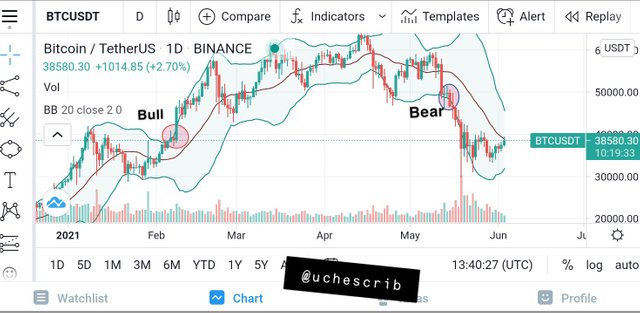
In the diagram above, I labelled two breakout points: Bear and Bull
The point labelled Bull shows the candlestick breaking out from the upper band. This signifies a bull movement in the price chart.
The point labelled Bear shows the candlestick breaking out from the lower band. This signifies a bear movement in the price chart.
Using The Bollinger Bands Indicator with a Trending Market
The Bollinger Bands indicator moves in the same direction of a trend. A trend is simply the direction of a market. In a bullish market, the Bollinger Bands would move in that same direction, engulfing the candlesticks.
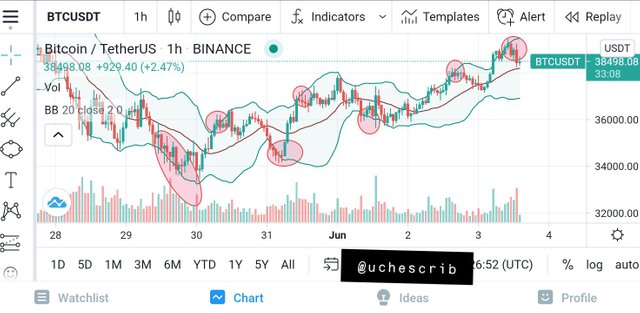
The diagram above is the 1 hour chat for BTCUSDT pair. Currently, Bitcoin is on the road to recovery after the previous bullish trend. But on the hour chart, Bitcoin is showing a reversal towards a bullish trend. This trend on the hourly chart may not last.
The highlighted areas are breakout points. It can be observed that there are minor trend reversals after each breakout point. With the use of the Bollinger Bands indicator, I can make good entry and exit points.
The breakout points give hints on when the market would make a reversal, which would help in the trading process. This helps in determining when a trend would end.
The Best Indicator to use with The Bollinger Bands
Every good trader knows that it is not advisable to rely on a single technical indicator. Combining multiple indicators is a better way of getting more out of the crypto market.
The RSI is a good indicator that can be combined with the Bollinger Bands in technical analysis. The RSI is also an oscillating indicator. This implies that it gives overbought and oversold signals just like the Bollinger Bands.
Another importance to of the RSI is illustrated in the image above. The RSI is used in detecting bullish and bearish divergences. The image above shows a bullish divergence. The price chart records a lower low, while the RSI records a higher low. Notice how the RSI moves above the 50 line after the divergence. The RSI is heading towards the 70 line which signifies a possible overbought market. It is also observed that the Bollinger Bands indicator is becoming narrow. This implies low volatility and a possible trend reversal. We can see how the RSI is used in confirming observations from the Bollinger Bands indicator. The MACD indicator is also good for combination with the Bollinger Bands indicator. This is because the MACD is a good indicator for detecting direction of trends and volume in a market.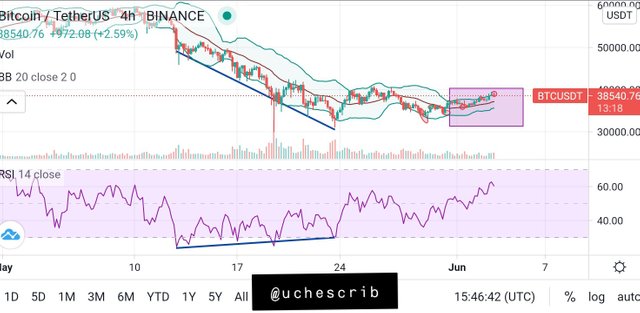
4hr chart for BTCUSDT
Best Time frame for the Bollinger Bands Indicator
In all my illustrations, I used the Bollinger Bands indicator in swing trade scenarios because that is what I prefer. The indicator proved to be very effective for swing trade.
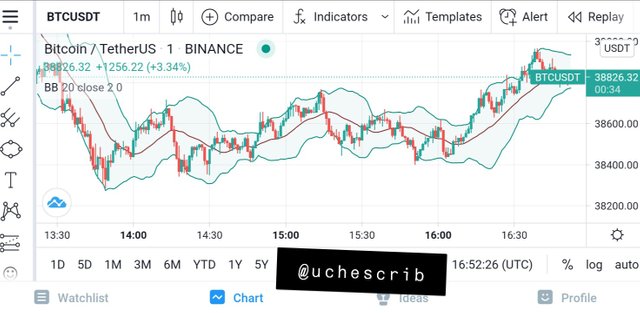
minute chart
The image above is a minute chart. A minute chart is used by scalp traders in making multiple trades in a day. The Bollinger Bands indicator observed every principle in this time frame.
I believe the Bollinger Bands indicator can be used for any time frame. I also think that a lower period (like 30minutes) should be set for scalp trading. It depends on the preference of the trader and his experience in trading.
Review of STEEM/USD
I will use the STEEM/USD price chart for this example. I'll use the time frame for swing trading because that's what I prefer.
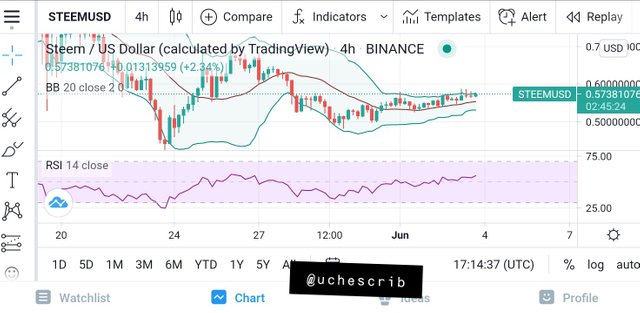
Steem has experienced a bearish market in the past week. The image above is the 4 hour chart for STEEM/USD. I observed that the Bollinger Bands were becoming narrow and the RSI is above the 50 line. This indicates a possible bullish trend but I decided not to take action yet.
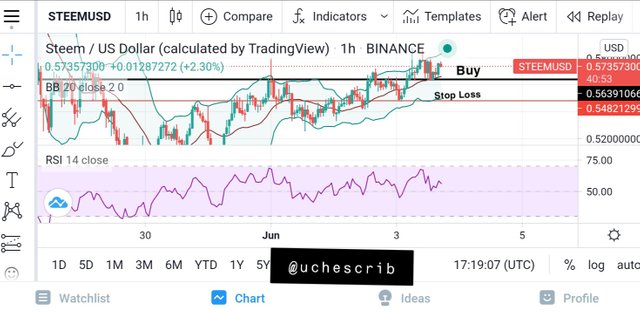
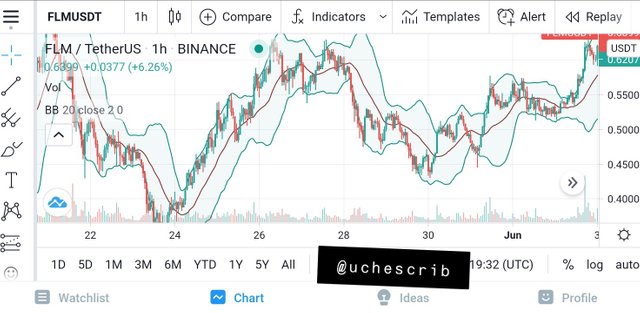
In the 1 hour chart above, I noticed that STEEM had already begun it's bullish move. I also observed that there was always a little regression in the past hours after the candlestick crosses the upper band. I decided to buy at the point of $0.5639 where the 20-day Moving Average touched the candlestick. The RSI also recorded the minor regression. My stop loss is placed at $0.5482.
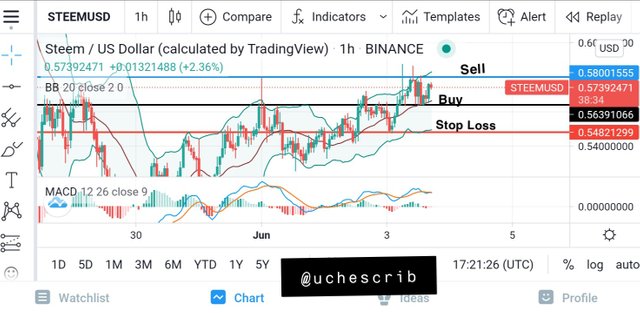
I decided to incorporate the MACD indicator inorder to confirm the trend. I noticed that the MACD line crosses the signal line downwards, but made a return movement upwards. The volume is also decreasing below the zero line in the MACD indicator. This was my confirmation that the price would still go up. My profit target is set at $0.5800.
- Entry: $0.5639
- Exit: $0.5800
- Stop Loss: $0.5482
Conclusion
The Bollinger Bands Indicator is a very good technical analysis instrument given that it measures volatility along with overbought and oversold patterns.
From my research, I found out that the Bollinger Bands can be misleading sometimes. Someone may take the little regressions in price as a sell signal. Because of this, it is best to combine the Bollinger Bands indicator with other technical indicators.
Special thanks to @kouba01
Hi @uchescrib
Thanks for participating in the Steemit Crypto Academy
Feedback
This is good content. Thanks for demonstrating your understanding of the Bollinger bands trading tool.
Homework task
8
Thanks for the review