Crypto Academy Week 16 - Homework Post for @fendit
The Wyckoff Method was created by Richard Wyckoff, and it is based on his research and use of many trading techniques. Wyckoff's discovery brought about so many theories. I'll will be discussing two, based on the requirements of the task at hand. They are:
- The Composite Man
- The Fundamental Laws

The Composite Man
Everyone who is into cryptocurrencies has obviously heard of "whales". These are the investors that hold a large proportion of the entire investment. This is not so different from The Composite Man.
The Composite Man is an evident entity in the market, who's actions in the market affects the entirety of the market. The Composite Man buys low inorder to push the market up, and sells high which causes the market to drop.
The Composite Man simply refers to the "whales" or the "big dogs" in the market. Because we know that The Composite Man is likened to whales, we can get a bigger picture of how "his" actions impact the volume of the asset that is being traded, which affects price movement.
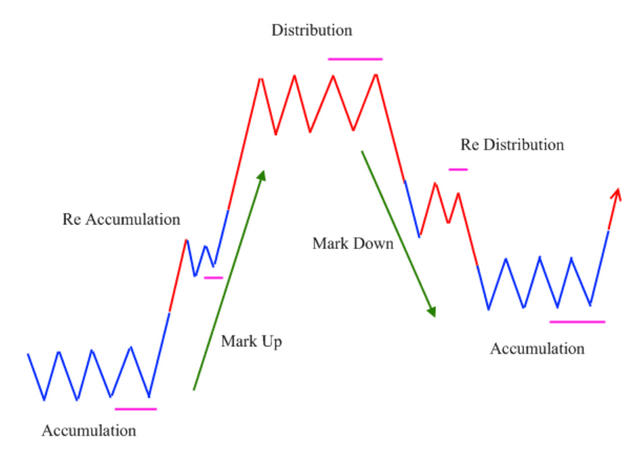
The activities of The Composite Man is simply illustrated in four phases:
source
Accumulation: In this phase, The Composite Man accumulates assets in order to reduce the supply. The accumulation is done gradually to avoid a sudden change in price. This is identified by a sideways movement in price.
Uptrend or Markup:During the accumulation process, prices would go up. This would entice other investors to jump into the market, increasing demand. The rising demand for this asset would cause the price to continuously go up. During this phase, there may be multiple accumulation phases which would reduce the supply of the asset.
Distribution: At this stage, The Composite Man would begin to "gradually" sell his accumulated assets. This would create supply of the asset in the market. At this point, a lateral movement would be observed in the price chart because some investors would make entries, hoping that the bullish trend would continue.
Downtrend or Markdown: At this point, The Composite Man sells a significant amount of the assets, pushing the market down. Other investors would also begin to sell their positions inorder to avoid any loss. This causes supply to be greater than demand, creating a bearish trend.
The Fundamental Laws of Wyckoff
The Wyckoff Method is based on three fundamental laws:
The Law of Supply and Demand
This is the most basic principle that determines the price of a commodity or whatsoever in a financial market. This implies that if the demand is greater than the supply, the price would rise. Also, if the supply is greater than the demand, the prices would drop. The demand and supply of the market can be determined through the study of the volume bars and the the market movement.Law of Cause and Effect
This law shows that market situations are a result of certain events. Wyckoff's study shows that the accumulation period would lead to an uptrend in the market. It also shows that the distribution period would eventually result in a downtrend.Law of Effort vs Result
Volume and price possess a significant relationship. Effort simply means volume, which is the amount of the cryptocurrency that is being traded. If there is high volume in the direction of the trend, it implies the continuation of that trend. In the same vein, weak volume results in weak results and a lateral movement or possible trend reversal.
Analysis of FLM/USDT Chart
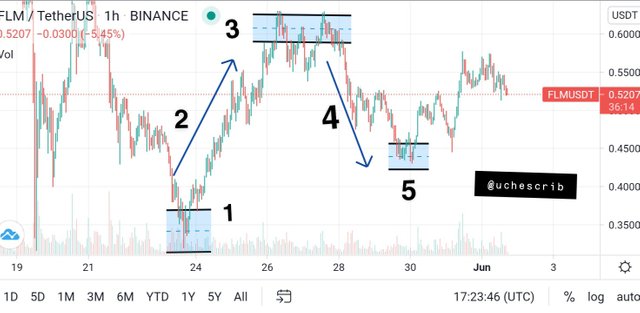
Phase 1
The Composite Man begins action at this point. He accumulates the assets thereby creating demand for it. The assets are accumulated gradually which causes lateral movement in the price chart.
Phase 2
Demand exceeds supply in this case. This is because other investors have taken interest in the market and have made entries into the market. This causes an uptrend in the price movement.
Phase 3
This is the distribution phase. The Composite Man begins to sell his assets gradually. Late buyers jump into the market at this point. This creates lateral movement in the price chart.
Phase 4
The Composite Man influences the market to go down. Other investors are leaving the market which causes a bullish trend. A re-distribution phase is observed in phase 4. This is because late buyers are trying to make entries at a low price. Supply exceeds demand here, causing a bullish trend.
Phase 5
This stage represents the end of the bear trend. This is the point where The Composite Man creates a long position inorder to push the market up. Notice how the volume is high at this point.
Because I believe that nobody should rely on one principle in technical analysis, I decided to incorporate other technical indicators to confirm the 5th phase.
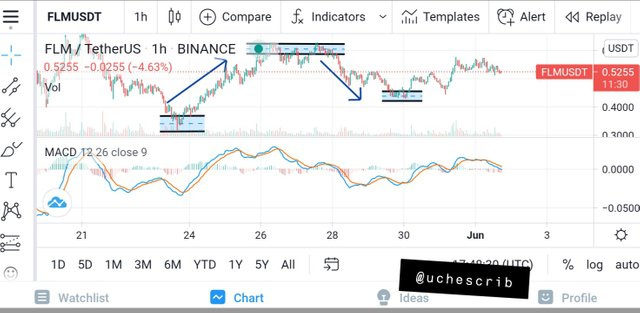
MACD indicator
The diagram above shows the MACD indicator in the price chart. The MACD line (blue) has crossed the signal line (red) and is about to cross the zero line downwards. This signifies a trend reversal towards the bullish trend.
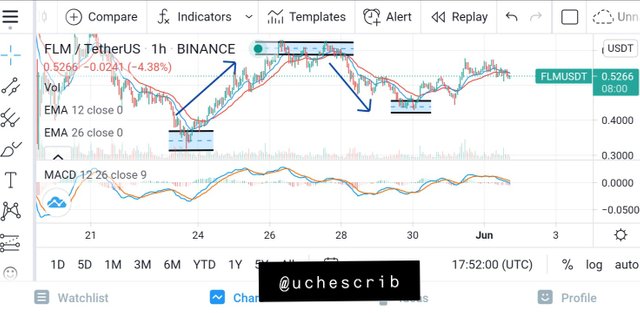
Exponential Moving Averages
In the diagram above, I brought in the Exponential Moving Average (EMA). The 12 EMA (blue) is about to cross the 26 EMA (red). This signifies that price would go up.
My decision would be to wait for some days so that I would be able to fully understand the state of the market. The MACD indicator is opposing the Wyckoff Method and the EMA lines. This may or may not signify re-accumulation. It is as a result of this uncertainty that I have decided to wait.
Conclusion
My thoughts on the Wyckoff Method is that it is a very good way to predict market trends. This is because it doesn't use any formula for derivation, rather it takes the psychology of investors into consideration just like in the Reverse Strategy.
The Wyckoff Method explains how the "big dogs" influence the market and how other investors follow in their footsteps. This understanding is what would help investors to make the right decisions and avoid being the "late buyers" who suffer from the actions of The Composite Man.
Finally, it is not advisable to use one method of technical analysis independently in making decisions. The Wyckoff Method should be used alongside other technical indicators for the best possible results.
Special thanks to @fendit
Thank you for being part of my lecture and completing the task!
My comments:
At first, everything was ok, but a bit too simple, I wish I had seen a bit more development on all tasks.
Then, you analysis on the composite man wasn't completelly accurate...
Overall score:
5/10
Thank you. I'll do better