Crypto Academy Week 15 - Homework Post for @yohan2on
.jpg)
Swing trading technique is the method of holding a position for a long period of time (days, weeks or months) after intensive study of chart patterns for longer periods in order to determine the direction of the market trend along the trading period.
As explained by the professor, this method involves the use of technical analysis to determine good entry and exit points. Studying longer market chart times would help in making better decisions than most other traders.

Swing trading on ETH/USDT Trading Pair
For my illustrations, I will be using TradingView application for Android. I chose the ETH/USDT pair under the Binance smart chain because of the high volume and volatility of the market.
Ethereum hit a new all-time high of $4,356.99 on the 12th of May, 2021. This marked a very good sign in the crypto world, or so we thought. Then came selling pressure and the overall dip experienced by a great percentage of digital coins.
Chart Analysis
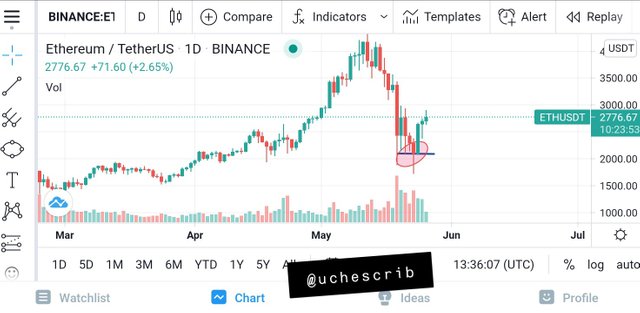
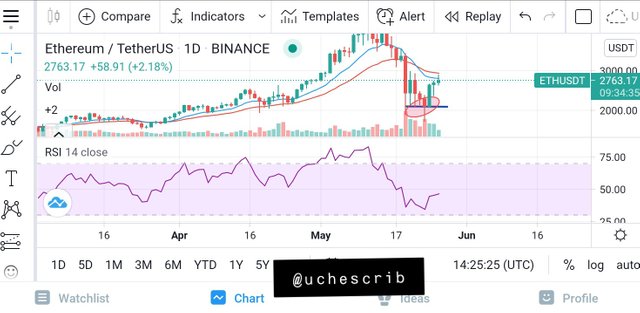
On the daily chart, the ETH/USDT market shows a buy signal on the candlestick chart. This was observed using a technique I know as the "Reverse Strategy". This implies that if the closing price of a previous candlestick is the same as the opening of the next, a trend reversal should be expected.
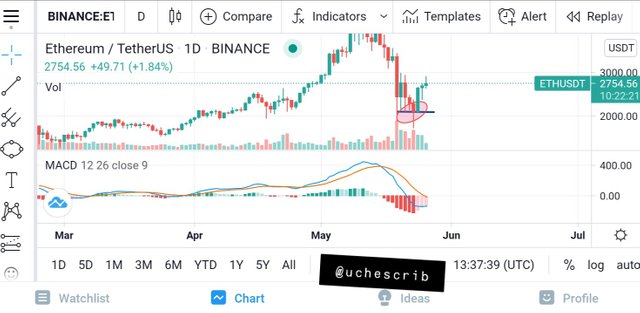
MACD indicator
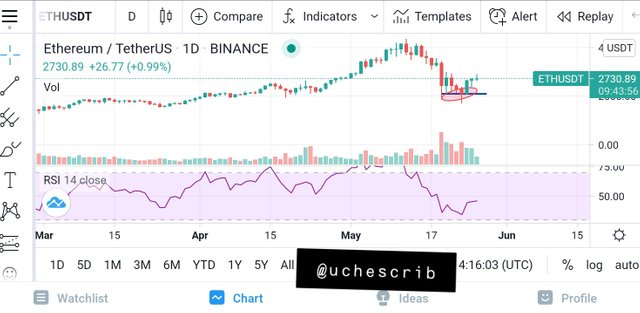
RSI indicator
In order to confirm this signal, I used the MACD indicator and the RSI. The MACD indicators showed no confirmation of the buy signal but displayed a possibility of crossing the signal line. On the other hand, the RSI indicator was about to cross the 50 mark. A crossing of the 50 mark upwards implies that the market is leaving a bearish trend. This gave me a confirmation.
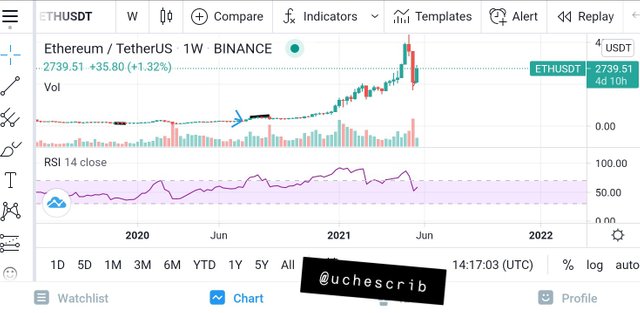
The weekly chart above displayed the RSI signal making a sharp reversal towards the 70 line as it was about to touch the 50 line. This signifies a possible market reversal for this week and maybe subsequent weeks to come. It does not guarantee an uptrend for a longer period of time like a month. The RSI on the weekly chart did not cross the 50 line during the bearish trend. This should create calm for investors.
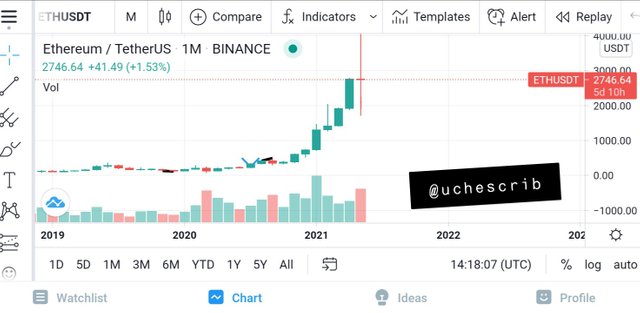
The monthly chart shows that the market tested a new highpoint during the month, before a significant drop during the bullish days. The price is struggling to stabilize and may record a new all time high by the end of the month or in the coming month.
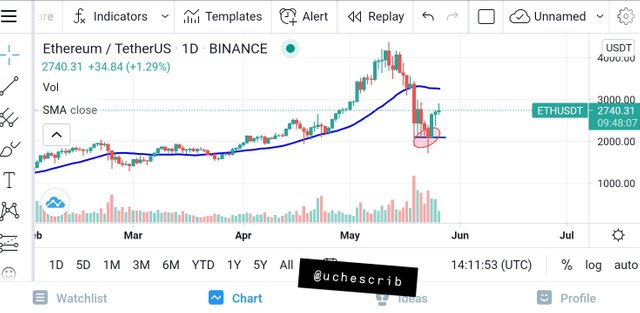
The blue line is a Simple Moving Average (SMA) with a value of 7 on the daily chart. I used this to confirm if the chart is about to form a support or resistance. When the SMA of 7 crosses the candlestick upwards, a bearish trend is expected with the candlesticks touching the SMA at intervals. In the chart, it is observed that the price is going up. I'm predicting that the SMA would cross the candlestick before the end of the month, signifying a bullish trend.
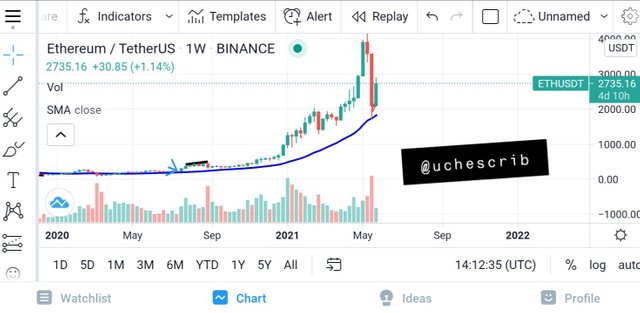
I switched to the weekly chart in order to confirm a possible bull trend. The chart shows that the candlestick touched the SMA line on the previous week during the bear movement. The price bounced back, causing the SMA to stay below the candlestick, destroying the possibility of a bear market for the week.
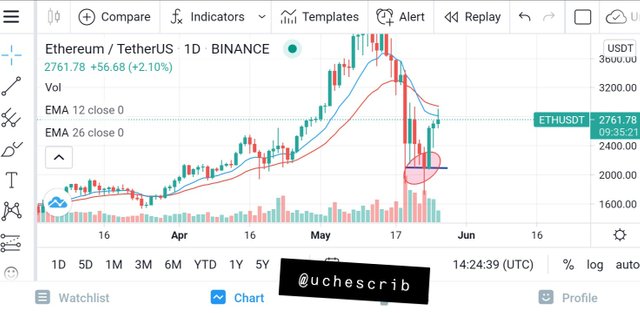
I decided to incorporate the Exponential Moving Averages (EMA) with period 12 (blue) and 26 (red) into the daily chart. The EMA is very good for determining support and resistance levels. It's also effective in predicting market trends.
The 12 EMA crossed the candlestick patterns downwards during the bearish days. On the candlestick chart, you can see that it is about to cross upwards. This signifies a coming bullish trend (i.e if a support is not formed where they meet).
RSI moving towards 50 line
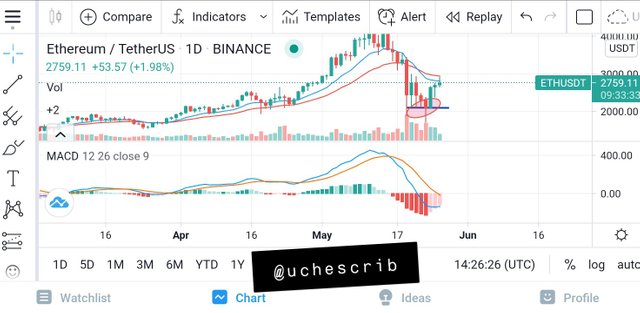
Red horizontal bars in MACD indicator reducing in length, signifying increasing volume
In order to confirm my predictions, I decided to use the RSI and the MACD indicator. The RSI shows a possibility of crossing the 50 line. The MACD shows volume increasing towards the bearish side. These are all signals for a bullish trend.
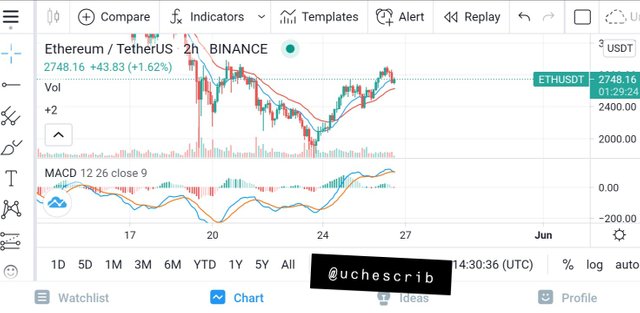
I intend to hold my position for a few hours or days, depending on the market situation. As a result of this, I switched to the 2-hour time frame on the candlestick chart. Using the MACD indicator, it shows the MACD line crossing the zero line towards the upward direction. Both lines are above the zero line, which signifies a bull market for the coming hours.
The 12 EMA is also above the 26 EMA. This signifies that the market would be bullish. With these two findings I came to my conclusion that the market is in a bullish trend.
Trade Management and Decision
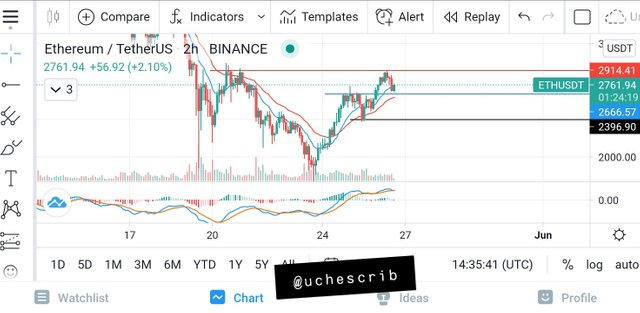
My decision is to buy at the previous point of about $2666.57 (blue line) which was the high point before the previous market regression. I would take profit at the support of $2914.41 (red line).
In order to minimize loss in case of unforeseen market reversal, my stop-loss would be set at the point of $2396.90 (black line).
Conclusion
Do not rush into a trade because market situations can catch even the most experienced trader off guard. Because of this, any smart trader would always set a stop-loss.
This lesson has been a very insightful one yet again. I hope anyone reading my post would find it easy to grasp.
Special thanks to @yohan2on
You've got a free upvote from witness fuli.
Peace & Love!
Hello @uchescrib,
Thank you for participating in the 7th Week Crypto Course in its second season and for your efforts to complete the suggested tasks, you deserve a 7/10 rating, according to the following scale:
My review :
A well-content article in which you clearly answered the topic in all its aspects. Your use of the MACD and RSI indicators to determine entry and exit points for trades is desirable in trading. What is missing from this work is an in-depth analysis of the price movement of the pair over different periods of time, which enables you to detect many signals.
Thanks again for your effort, and we look forward to reading your next work.
Sincerely,@kouba01
Thank you for the review. I really enjoyed this lesson. I'll improve on expressing myself better.