Crypto Academy / Season 3 / Week 3 - Homework Post for @cryptokraze
Break Retest Break Strategy
The price chart of a crypto asset always shows movement towards a direction. The direction it moves would determine the trend of the market. The Break Retest Strategy is a technique that is used in market analysis, that uses pullbacks and rebounds in a trend which are marked by support and resistance levels.
What do I mean by "...which are marked by support and resistance levels"? It means that each pullback would form a retest level before breaking the latest swing point level. Depending on the trend, the retest level can either fall on a support or resistance level.

Important Levels using BRB Strategy
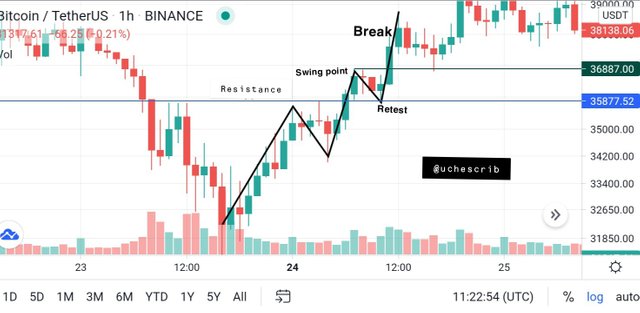
Uptrend
For an uptrend scenario, you can notice the zig-zag movement upwards. There's a breakout from the resistance level. A swing point is formed as the price tends to make a pull back to retest the resistance level. As it reached the resistance level, price bounced back and crossed the swing point.
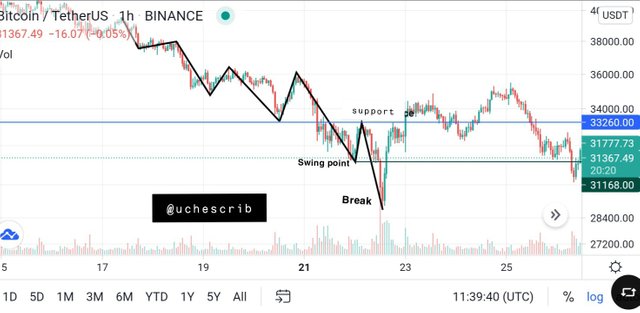
Downtrend
In a downtrend scenario, a zig-zag movement is observed heading downwards. There's a breakout from the current support level. A swing point is formed as price makes a pull back from the downtrend. Price retests the support level and rebounds to continue the downtrend. Another breakout is formed as price crosses the swing point.
Trade Entry and Exit Criteria for Buy Position
Trade Entry
Identify the resistance level and mark it out.
Watch the price chart and wait for a breakout from the resistance level. Mark out the end of the first breakout as the swing point.
Price would pullback and retest the resistance level.
As price reaches the resistance level, it would rebound and breakout through the swing point.
Create a buy entry above the swing point level.
Trade Exit
Once an entry has been made, set up stop loss level in case the trade doesn't go as planned.
Stop loss should be set a few pips below the resistance level incase the trade goes against the plan. If the price reaches this level, it'll cause the asset to be sold with a very minor loss.
Take profit level should be set at a 1:1 risk-reward ratio if you're new to this technique.
If price reaches the take profit level, create a sell order and close the trade.

Trade Entry and Exit Criteria for Sell Position
Trade Entry
Identify and mark out the support level on the price chart.
Wait for price to breakout through the support level and mark the end of the breakout as the swing point.
Wait for price to pullback and retest the support level.
As price reaches the support level, it'll rebound and breakout through the swing point.
Create a sell entry below the swing point level.

Trade Exit
Once an entry has been made, set up stop loss level in case the trade doesn't go as planned.
Stop loss should be set a few pips above the support level incase the trade goes against the plan. If the price reaches this level, it'll cause the trade to be closed with a minor loss.
Take profit level should be set at a 1:1 risk-reward ratio if you're new to this technique. As you get better with this technique, you can increase the risk-reward ratio however you prefer.
If price reaches the take profit level, complete the order and close the trade.
Practical Use of BRB Strategy
Case 1:
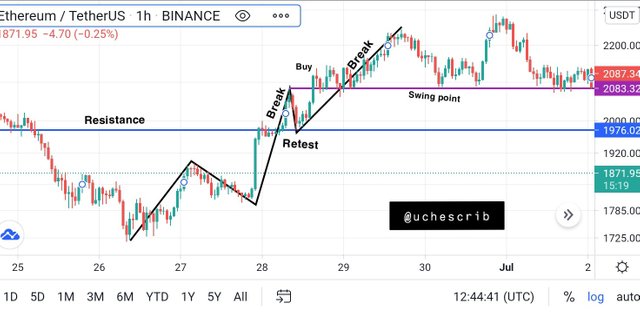
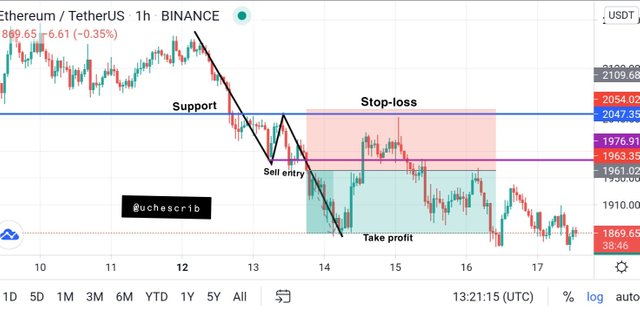
On the 1-minute chart for ETHUSDT, the price went above the resistance line. I waited for a pull back before making a buy entry. The pull back happens and the price rebounded and went back up to cross the resistance line. I created an entry at 1880.49. My stop loss was set at the price level of 1873.64 which is some pips below the last pull back that occurred before the breakout. Using a risk-reward ratio of 1:1, my take profit level is at 1887.34.

Case 2:
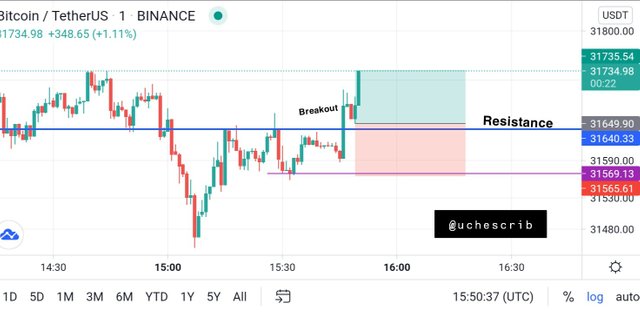
On the 1-minute chart of BTCUSDT, the price made a breakout through the resistance level. I immediately opened a buy position at 31649.90 which was some pips above the breakout. The price experienced a little pull back which activated my buy order. I set my stop loss at the level 3156.61 which is some pips below the swing point. Using a risk-reward ratio of 1:1, my take profit level was set at 31735.54.
Conclusion
The BRB strategy is very reliable if used properly. In my opinion, it would be best to combine it with technical indicators, especially momentum indicators like the RSI. This is important because the RSI shows the strength of the trend.
Special thanks to @cryptokraze.
Dear @uchescrib
Thank you for participating in Steemit Crypto Academy Season 03 and making efforts to complete the homework task. You got 6.5/10 Grade Points according to the following Scale;
Key Notes:
We appreciate your efforts in Crypto academy and look forward for your next homework tasks.
Regards
@cryptokraze