Crypto Academy / Season 3 / Week 2 - Homework Post for @yohan2on
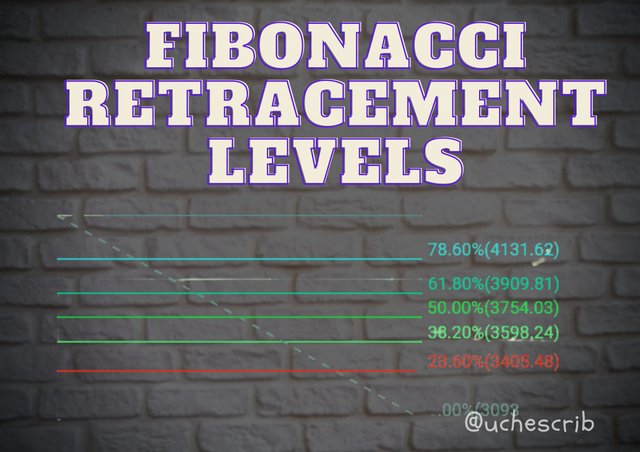
Fibonacci Retracement Levels
Fibonacci retracement levels are horizontal lines that are plotted on a the price chart, which show support and resistance levels of price movement. This lines are derived from the Fibonacci sequence which was introduced by Leonardo Bonacci in the early 19th century.
The Fibonacci sequence goes as follows; 0,1,1,2,3,5,8,13,21,34,55,... and continues to infinity. It is derived by the sum of the two preceding numbers.
The Fibonacci retracement levels have the values 23.6%, 38.2%, 61.8%, and 78.6%. The 50% level is included. although it is not derived from the Fibonacci sequence, it used as a balance level for price movement.

Plotting the Fibonacci Retracement Levels
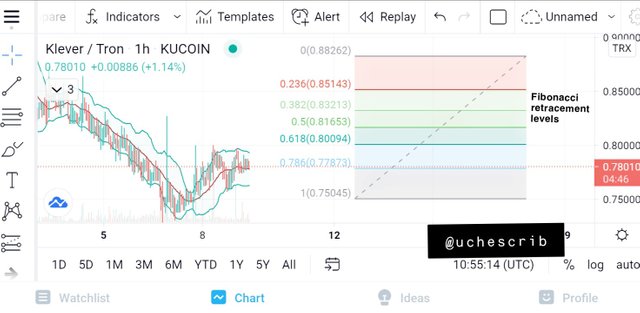
For all my illustrations, I'll use TradingView application for Android. Plotting the Fibonacci retracement levels requires that the high points and low points of the price chart be taken into consideration.
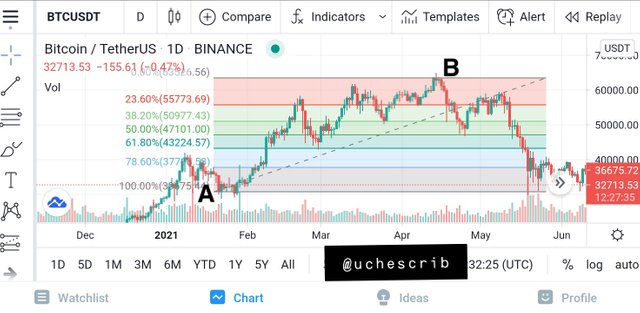
For an Uptrend;
Taking the lowest point as "A" and the highest point as "B", plot the Fibonacci retracement levels from point A to point B. The various levels would be used in detecting support levels for retracements from the uptrend. These retracements are good buy opportunities in the market.
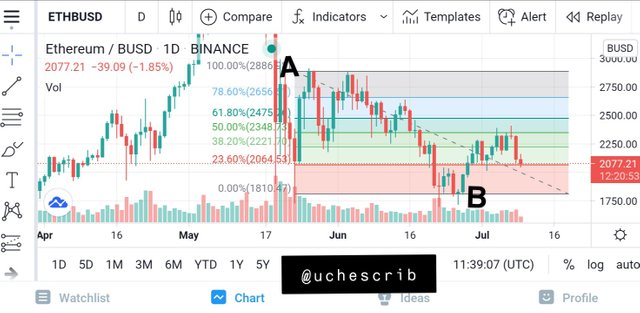
For a Downtrend;
Taking the highest point as "A" and the lowest point as "B", plot the Fibonacci retracement levels from point A to point B. Any retracement from the downtrend would be indicated as a resistance on the Fibonacci retracement levels, giving traders good sell opportunities.
Practical Use of Fibonacci Retracement Levels
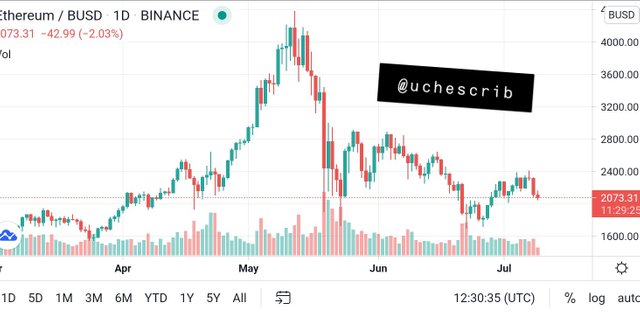
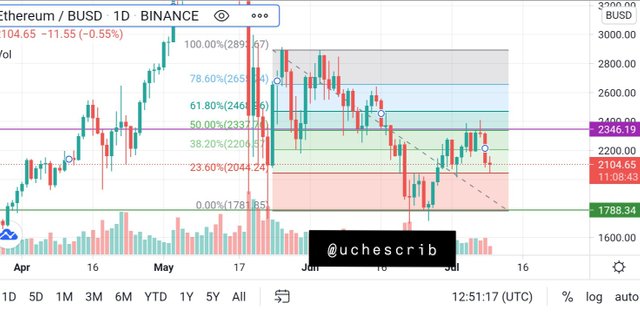
Step 1: I opened the chart for ETHBUSD on TradingView.
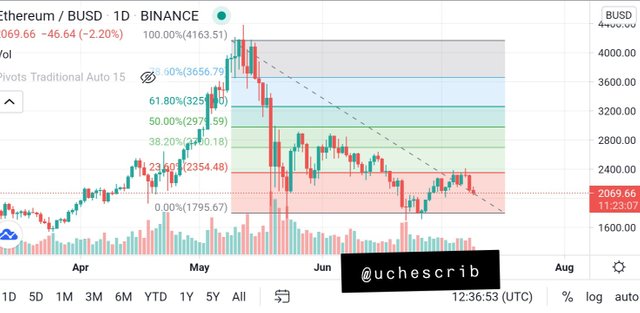
Step 2: I plotted the Fibonacci retracement levels from the last high to the current low. From this, I can assume that a support is formed at 0% and a resistance is formed at 23.6%.
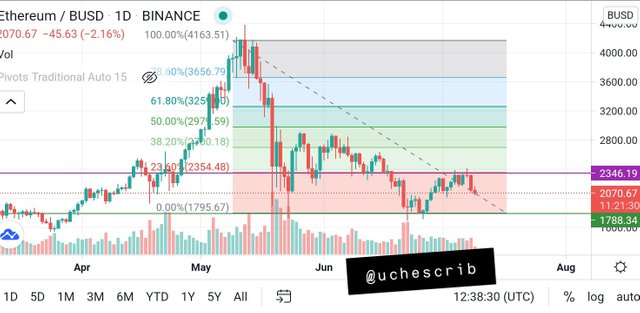
Step 3: I used a green line to market the current low and a purple line to mark the assumed resistance at 23.6%.
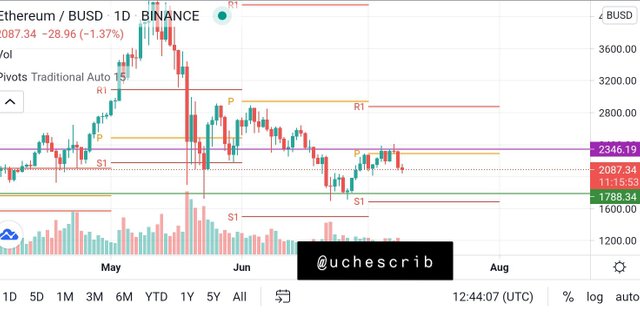
Step 4: I brought in the Pivot Points. The main pivot point almost has a similar value as the purple line, and S1 almost has a close value as the green line. This indicates that S1 is a possible support line for price movement.
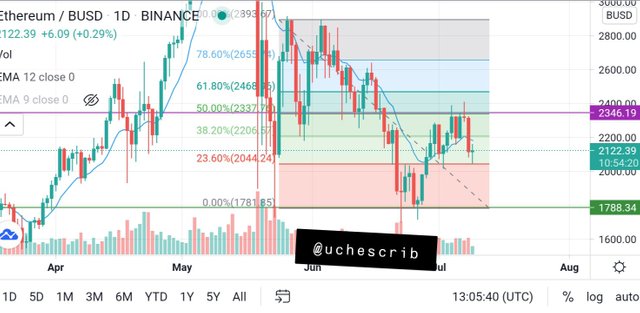
Step 5: I plotted new Fibonacci retracement levels taking the start point as the highest point since the regression of the downtrend.
I noticed two things:
The 50% level is the same as the purple line, which is the 23.6% level of the initial Fibonacci retracement.
Price is about to reach the current 23.6% level and may pullback or cross that level.
Step 6: At this stage, I incorporated the 12EMA to the chart. The 12EMA just made a cross on the price chart and is above the candlestick chart. This signifies a possible continuation in the downtrend.
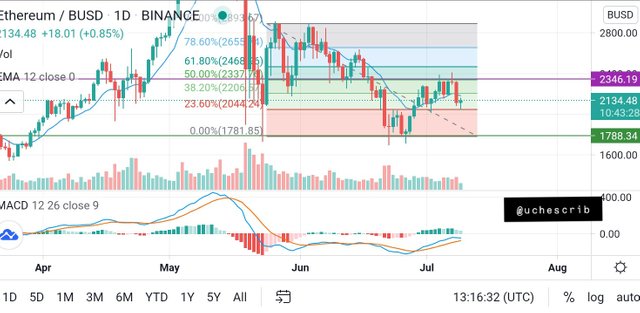
Step 7: I brought in the MACD indicator to the chart. The MACD line and the signal line are showings signs of crossing the zero line. This indicates a possible bullish move. The MACD line is indicating a little downward movement which may signify a little continuation of the downtrend before the pullback.
Step 8: My buy targets are at 1740.52 and 2006.11. If I get a signal that the price would pull back as it reaches the 23.6% mark, I'll buy at a price of 2006.11. If the downtrend continues, my buy target would be somewhere around 1740.52.
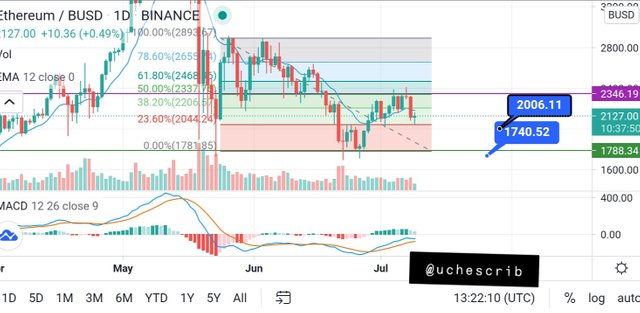
Step 9: Take profit targets are at 50% level (2337.76) and 61.8% level (2468.96).
Step 10: I'll set my stop loss at 5%-10% pips below my buy target.
Note
I couldn't get a confirmation signal from the indicators. In this situation, I would wait for some time before taking a decision.
Conclusion
Fibonacci retracement levels help traders in detecting retracements in the price chart of an assets. Retracements are minor reversals from a trend and are used to place buy and sell orders.
Fibonacci retracement levels do not give any signals when there is a change in trend. As a result of this, it is best to combine this tool with other technical indicators. In my illustration, I used the Exponential Moving Average (EMA), the Moving Average Convergence Divergence (MACD) and the Pivot Points.
The Fibonacci retracement levels are also useful for setting stop loss in order to minimize potential loss.
Special thanks to @yohan2on.
Hi @uchescrib
Thanks for participating in the Steemit Crypto Academy
Feedback
That's a poor trade decision. You had flowed very well from the previous steps. All indicators were signalling that the market is heading downwards. The best decision is a sell. Always trade with the trend for high probability trades. Your first profit target would rather be at $1740.52 and the stop loss would be slightly above that swing high $2346. You used the retracement levels well to spot for that 50% retracement level which is now acting as a strong resistance area.
Homework task
7.5