Crypto Academy / Season 3 / Week 2 - Homework Post for @reminiscence01
Introduction
So many tools are used for analysis of a live market. These tools help the traders or analysts to know the nature of a market at a given period of time. Knowing the current nature of the market would make it possible to predict the future state of the market. In this post, I'll be discussing one of the most basic tools which traders and analysts make use of. It is know as The Japanese Candlestick Chart.

Japanese Candlestick Chart
The Japanese candlestick chart was created by Munehisa Homma in the 1700s. He developed this chart technique by studying the relationship between supply and demand, and how the emotions of traders affect the market.
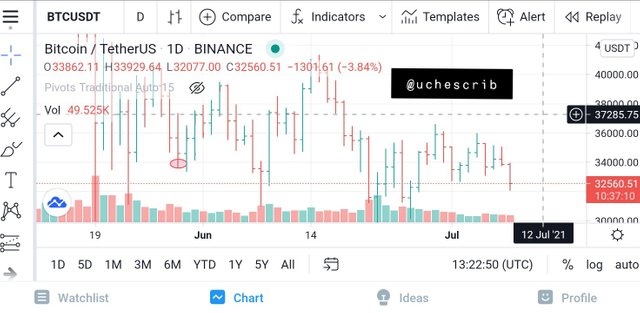
The Japanese candlestick chart represents price movement over a period of time. The past price movement can be used to predict future price movement simply by identify patterns on the chart.
The chart is also reliable because it dictates the emotions of participants in the market. Emotions would cause traders to take certain actions in the market, which would affect the price movement. These situations can be read with the use of the Japanese candlestick.
The Japanese candlestick may be useful in reading price movements, but it yields the best results when combined with other technical indicators. The Japanese candlestick is usually used as reference point during market analysis.
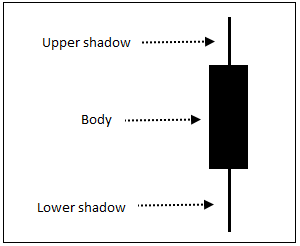
Parts of The Japanese Candlestick Chart
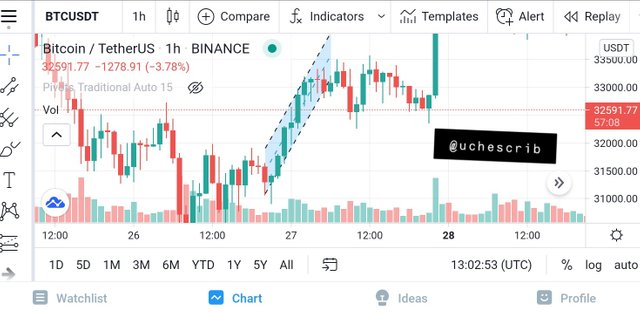
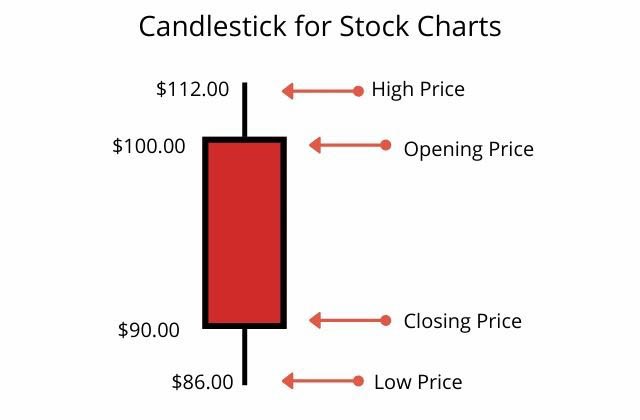
The image above a displays the parts of the Japanese candlestick. The parts are:
Open: This point indicates the price at which the markets began in a particular time period. If it is a 1-day chart, the open would be the price that the day began with.
Close: This point indicates the last price of the market in a particular time period. In a 1-day chart, the close would be the last price which the market hit at the end of the day.
High: This is the greatest price which the market reaches in a particular period of time.
Low: This is the lowest price which the market reaches in a particular period of time.
source
Other parts are:
Body: This is the distance between the opening price and the closing price of the candlestick. It is the thick part of the candlestick.
Shadow: The shadow is the distance which price moved, but could not close. It is shown as a thin line on the chart. It is also known as the wick or the tail.
Describe any other two types of charts? (Screenshot required)
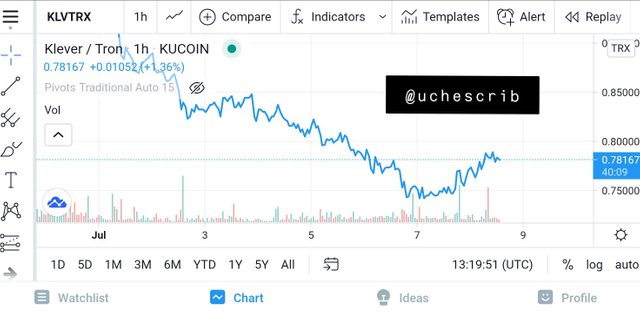
Line Chart
The line chart is another commonly used chart for displaying price movement over a period of time. Unlike the Japanese candlestick chart, the line chart only takes into consideration the closing price of the market. This means that the chart is plotted as the closing price against time.
The line chart filters all the noise from the market by giving only the last price which a commodity or asset reached in a period of time. This can be used to determine the trend of the market.
The line chart doesn't give much signals. Support and resistance levels can be easily identified with this chart system.
Coinmarketcap and Coingecko are examples of platforms which implement the line chart as a default chart system. I believe this is because it helps traders and analysts to keep track of the market situation without much details.
Bar Chart
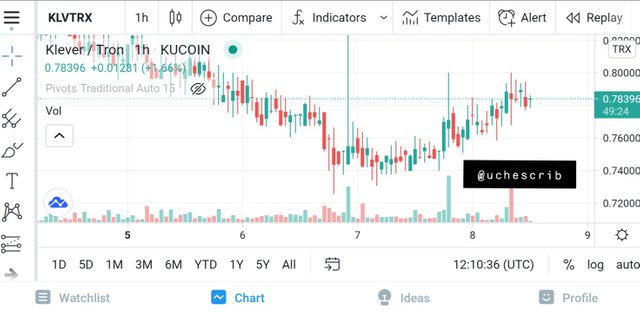
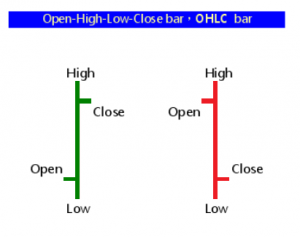
The bar chart is a chart system that is very similar to the Japanese Candlestick Chart. It is a chart system made up of horizontal lines with one tick on each side of the line.
The bar chart can be used to determine the opening price, closing price, high and low of the market in a time period. Support and resistance can also be determined using this chart system.
source
The image above shows the various parts of the bar chart;
A tick on the left represents the opening price
A tick on the right represents the closing price
The highest point of the bar represents the highest price in a time period
The lowest point of the bar represents the lowest price in a time period
Reasons why the Japanese Candlestick Chart is mostly used
Whenever someone ventures into the trading world as a newbie, he is faced with the Japanese candlestick chart. This chart system is widely used around the world. The following are reasons why the Japanese candlestick chart is very popular:
This chart system displays the opening and closing price of the market in a very simplified fashion. The body of the candle stick is the distance between the opening and closing price. With this, the two points can be easily identified.
The Japanese candlestick chart indicates the highest price which the market reaches at a particular time period, and the lowest price in that same time period.
This chart system gives the distance which price travelled in a time period. The body and the shadow of the candlestick is the complete price movement of an asset over a particular period of time.
Areas of support and resistance can easily be indicated with the Japanese candlestick.
The Japanese chart system is useful in predicting the future situation of a market. These predictions help in good decision making.
The Japanese candlestick chart is more convenient when it is combined with various technical indicators. Combining the candlesticks with technical indicators would make for a better overall decision making.
The current state of the market can be determined simply by observing the colours and lengths of the candlesticks.
The colours and shapes of the candlesticks also makes it easy to know the direction of the market.
Basic Japanese Candlestick Chart Analysis
The Japanese candlestick is used for determining price movement. This is easily determined by the colour of the candlestick.
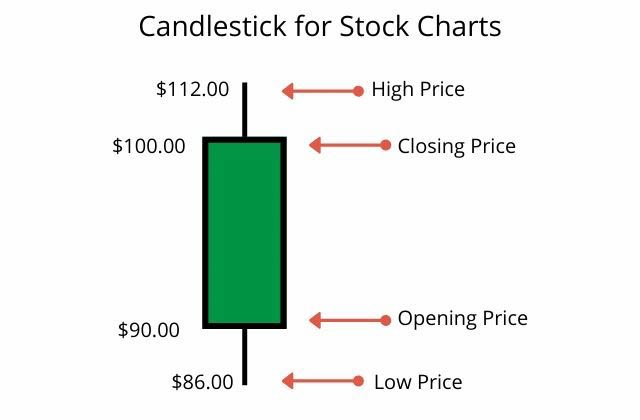
Green candlestick
This represents an upward movement of price. It shows that the current price is higher than the previous one. A collection of these green candlesticks indicates an uptrend or a bullish trend. In this situation, a lot of buyers are making entries into the market, which causes the price to increase.
Anatomy of the green candlestick:
source
The green or bullish candlestick has its opening price below the closing price. This is because of the increase in price of the asset over a period of time. Its high is above the the closing price, and its low is below the opening price.
Red candlestick:
This represents a downward price movement. It shows that the current price is lower than the previous one. A collection of these red candlesticks indicates a downtrend or a bearish trend. This situation is caused by people selling off their positions in the market, causing a fall in price.
Anatomy of the red candlestick
source
The red or bearish candlestick has its opening price above the closing price. This is because of the decrease in price of the asset over a period of time. Its high is above the the opening price, and its low is below the closing price.
Conclusion
The Japanese candlestick chart gives more details of the market than any other chart system. Because of this, it is widely used by traders for market analysis.
Understanding how to read the price chart should be the first step for anyone who is new to crypto trading. The chart gives basic information on the market, and can easily be interpreted. Knowledge on reading charts is the "baby steps" for trading.
Special thanks to @reminiscence01
Hello @uchescrib , I’m glad you participated in the 2nd week of the Beginner’s class at the Steemit Crypto Academy. Your grades in this task are as follows:
Observations:
Please use images from copyright free source. The image you used has a website name attached to it. Please remove it.
Recommendation / Feedback:
Thank you for submitting your homework task.
Thank you prof. I've removed the image