Crypto Academy / Season 3 / Week 2 - Homework Post for @cryptokraze
Market Structure
Market structure is simply the movement of price of an asset which is indicated by patterns on a price chart. Market structure is shown by zig-zag patterns on the price chart, with significant high points and low points.
Different patterns are depicted depending on the market situation:
Zig-zag movement upwards depicts an uptrend or bull market.
Zig-zag movement downwards depicts a downtrend or bear market.

Market Structure Break Strategy (MSB)
Market Structure Break Strategy is a technique that uses the zigzag patterns formed on the price chart for decision making. This strategy is effective for making entries, exits, setting a stop loss, determining profit levels and for price forecast.
The MSB makes use of the high and low points that are formed on the zigzag patterns for identifying the current market situation this is used in making good trade decisions based on the market situation.
In order to effectively utilize the Market Structure Break Strategy, the following are very important:
- High points
- Low points
- Direction of the trend
- Stop Loss
- Risk-Reward ratio
Concept of Lower Highs and Higher Lows
When using the Market Structure Break Strategy, it is important to take into consideration the position of a high or low in relation to previous highs and lows. For better understanding, let's take two different market situations as illustrations.
Uptrend
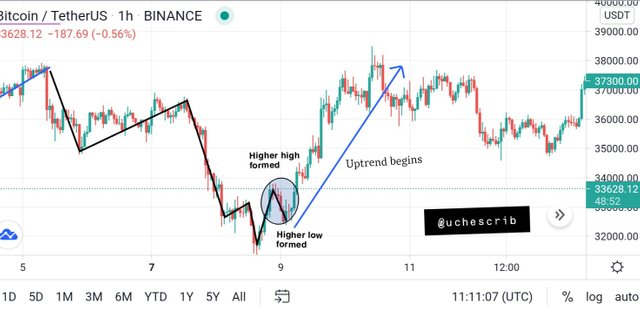
An uptrend is identified with higher low and high points than the previous low and high points. These higher highs and lows are formed when the price movement forms a zigzag pattern going upwards. To confirm that a position is a new high, you'll need to wait for two or three candles to close above the previous high.
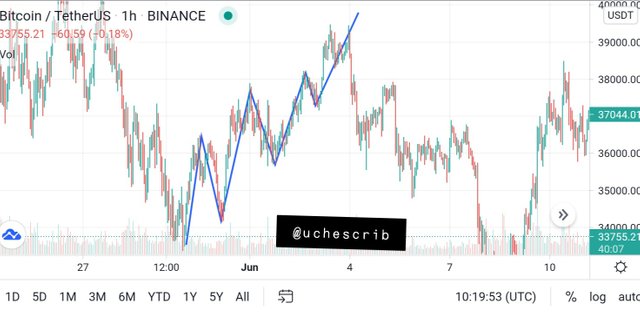
The image above shows the 1-hour chart of the BTCUSDT pair. It illustrates the concept of higher highs and higher lows in an uptrend.
Downtrend
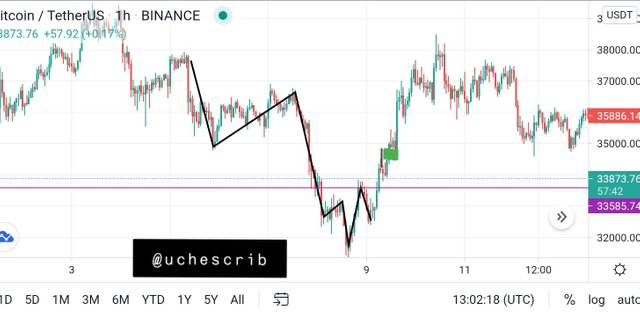
A downtrend is depicted with lower high and low points than the previous high and low points. These lower points are formed in a bear market as the price chart shows a downward zigzag pattern. To confirm that a position is a new low, you'll need to wait for two or three candles to close below the previous low.
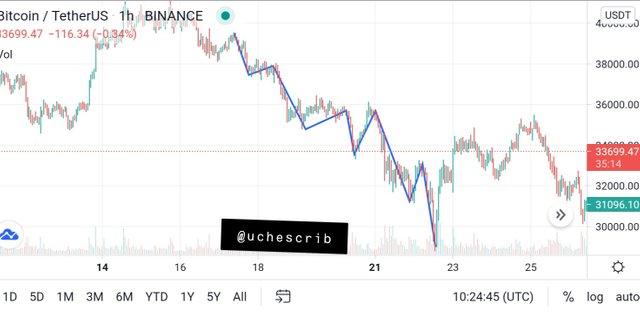
The image above shows the 1-hour chart of the BTCUSDT pair. It illustrates the concept of lower highs and lower lows in an uptrend.
Identifying Trend Reversal with the Market Structure Break Strategy
This strategy is very versatile as it can also be used in identifying trend reversals. Careful study and familiarity with the patterns is what makes identification of trend reversals possible. This is also done by taking into consideration the position of the high and low points that are formed by the zigzag patterns.
Let's use the two market situations, uptrend and downtrend, as illustrations:
Uptrend
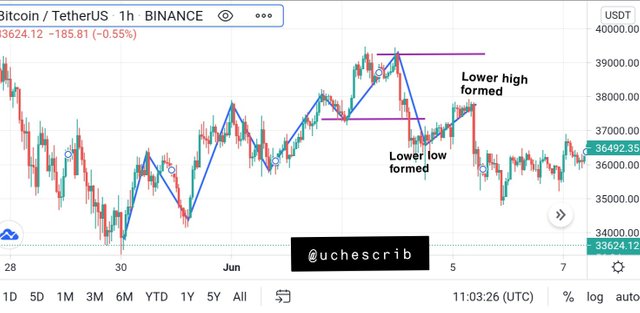
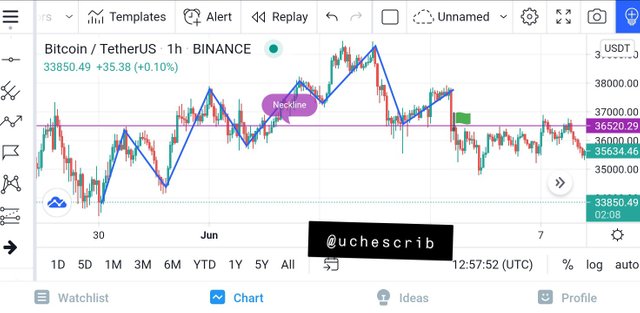
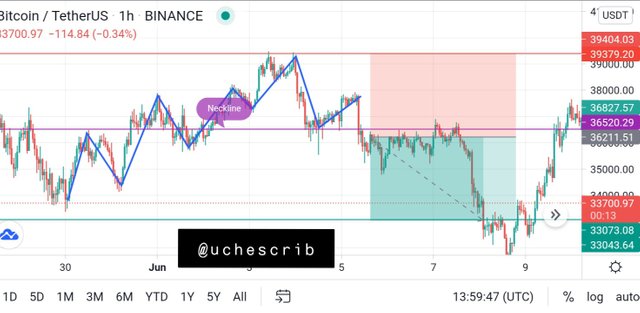
Using the Market Structure Break Strategy, an uptrend is characterized by higher highs and higher lows. These patterns are formed in the direction of the trend. In the event of a trend reversal, a lower low point is formed. Using this low point, a neckline is drawn. The price would make a pull back before it drops low again. If the second drop falls below the neckline, then there is a market reversal, and a downtrend has begun.
Downtrend
A downtrend is characterized by lower highs and lower lows. When a trend reversal is about to occur, the pattern movement forms a higher high. A neckline is drawn using this signal. The price would pull back before experiencing another upward movement. If this second movement crosses the neckline, then a market reversal has occured and a bull move would begin.
MSB on a Buy Entry
In order to use the Market Structure Break Strategy in a buy situation, the market must be in a downtrend. This downtrend would be depicted with lower lows and lower highs along the zigzag pattern.
Watch out for a higher high. When this occurs, a neckline would be drawn using the higher high as a reference point.
Wait for the candlestick that would cross the neckline and move upwards. This would confirm the market reversal.
Place a buy order above the close on the candles stick that crossed the neckline. In my illustration below, the buy position is marked with a flag.
MSB on a Sell Order
For a sell position, the market should be in an uptrend. The uptrend is identified with higher highs and higher lows formed along the zigzag pattern.
Watch for a lower low. When this occurs, a neckline would be drawn using the lower low as a reference point.
Wait for the next candlestick that would cross the neckline downwards. This is a confirmation of the market reversal.
Create a sell position below the close of the candlestick that crossed the neckline. In my illustration, the sell position is marked with a flag.
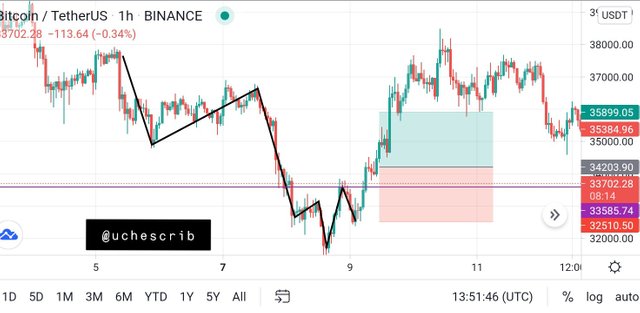
Entry and Exit on Long Position
Using the MSB, I concluded that an uptrend is about to begin. I opened a position at a level of 34203.90 above the candlestick that crossed the neckline.
I placed a stop loss a few pips below that last lowest low at the point 32510.50.
Using an risk:reward ratio of 1:1, my take profit point was at the point 35899.05.
Entry and Exit on Short Position
Inorder to open a short position, I confirmed that the bearish trend is about to begin. A lower low was form with which I used as a reference point for forming a neckline.
After a candlestick had crossed the neckline downwards, I opened a short position below the close of the candlestick.
I placed a stop loss a few pips above the last highest high and used an R:R ratio of 1:1 to determine my take profit point.
Demo Trades using Market Structure Break Strategy
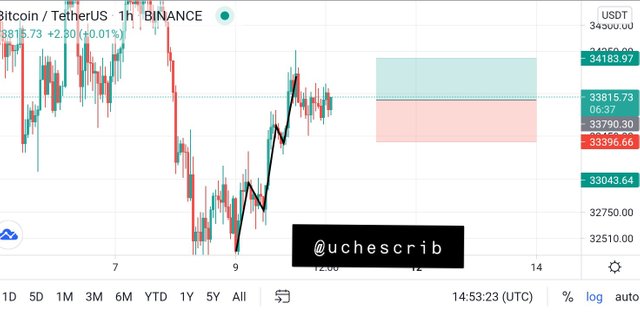
The first scenario is a 1-hour chart for BTCUSDT pair. I used the Market Structure Break Strategy and determined that the coin pair is in an uptrend. I made an entry at 33790.30 which was a few pips away from the current market price. I set my stop loss at 33396.66 few pips below the last low point and used a risk reward ratio of 1:1 to set my profit target at 34183.97.
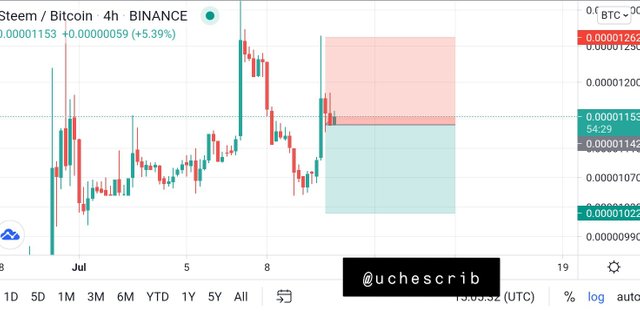
The second scenario is a 4-hour chart for STEEMBTC. Using the Market Structure Break Strategy, I determined that the market is currently in a downtrend. I decided to go short by creating a position at the price of 0.00001142. My stop loss was set a few pips above the previous highest high at 0.00001262. Using a risk reward ratio of 1: 1, I set my profit target at 0.00001022.
Conclusion
The Market Structure Break Strategy is a technique that is very effective when used individually for making decisions in order to make profit. Although it is effective on its own, it is also good to combine it with technical indicators for better results.
Special thanks to @crytpokraze.