Crypto Academy / Season 3 / Week 1 / Homework Post for @kouba01
Ichimoku Kinko Hyo Indicator
Ichimoku Kinko Hyo is a technical indicator that is used to determine the momentum of price movement and determine strong support and resistance levels.
This indicator was created in the 1930s by a japanese journalist whose name was Goichi Hosoda. "The Balance Chart From One Look" is the English translation of the name "Ichimoku Kinko Hyo". The name would seem over-ambitious to any person who is new to this indicator, but it has actually proven to be deserving of the title.
The Ichimoku Kinko Hyo is very useful because of its efficiency and proficiency in market analysis. This indicator took decades to become recognized international, but it's presently widely used by traders for the best opportunities in trading.

Different Lines of Ichimoku
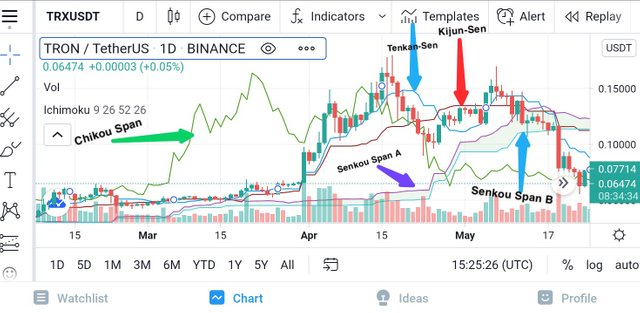
Ichimoku Kinko Hyo consists of five lines. They are:
- Tekan-Sen
- Kijun-Sen
- Senkou Span A
- Senkou Span B
- Chikou Span
Tenkan-Sen and Kijun-Sen
These lines are represented by the median high and low of a certain time period. The are used in measuring the momentum of price movement. These lines form straight horizontal lines (landings) if there are no significant highs and lows over a period.
The Tenkan-Sen and Kijun-Sen are also used to determine levels of support and resistance. They are likened to SMA but they're measured using highs and lows while SMA takes opening and closing points into consideration.
Formula: (High+Low)/2
- Tenkan-Sen is measured over 9 periods
- Kijun-Sen is measured over 26 periods
Senkou Span A and Senkou Span B
Senkou Span A and Senkou Span B are both components of the Ichimoku that are projected into the future. The Senkou Span A is calculated as the average of Tenkan-Sen and Kijun-Sen, which is plotted 26 periods into the future.
The Senkou Span B line is the median of the highest and the lowest points of the last 52 periods. The values are plotted into the future, giving rise to the Senkou Span B.
These lines are used as predictions for price movement in the future. Just like the Tenkan-Sen and Kijun-Sen, they form landings too.
These two lines form an area between them. This area is known as The Cloud and is coloured on the graph for easy identification. The cloud is used as a tool for indicating for support and resistance.
The Chikou Span
The Chikou Span is the line that gives an image of the price chart, but is lagging with 26 periods. Because of this, the Chikou Span is also known as the Lagging Span. The Chikou Span is an underestimated component and we'll get to know the reasons for this.
Steps taken to Add the Ichimoku indicator to the Chart?
Step 1: Open TradingView
Step 2: Select "fx Indicators"
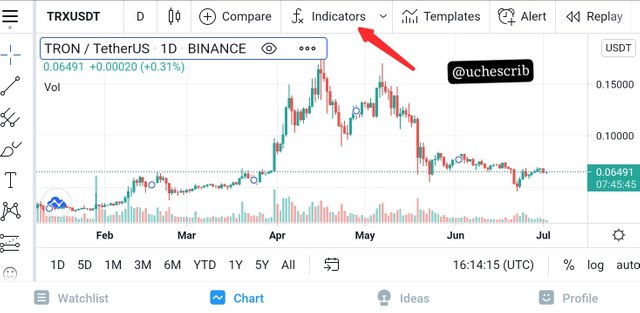
Step 3:. Type "Ichimoku" in the search bar.
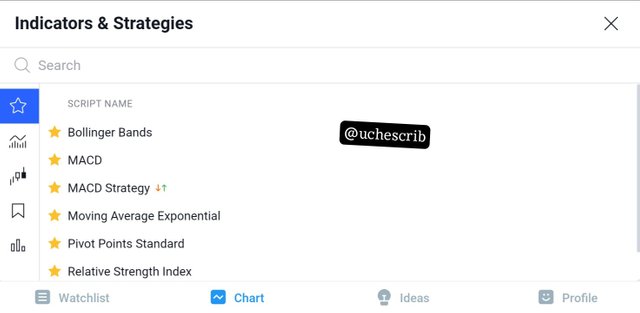
Step 4: Select "Ichimoku Cloud"
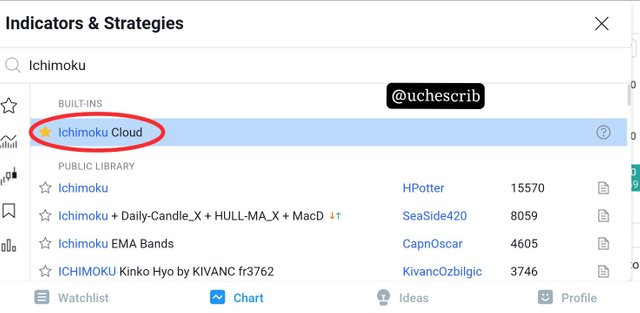
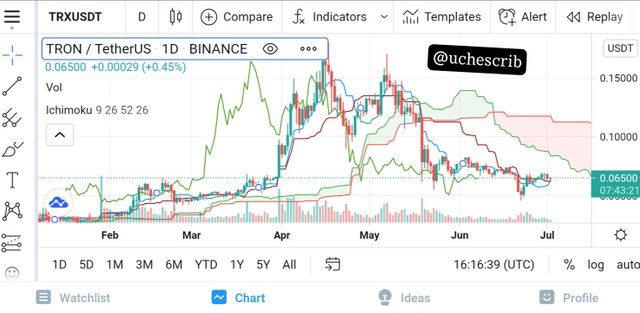
Step 5: The indicator has been successfully added to the chart.
Default Settings
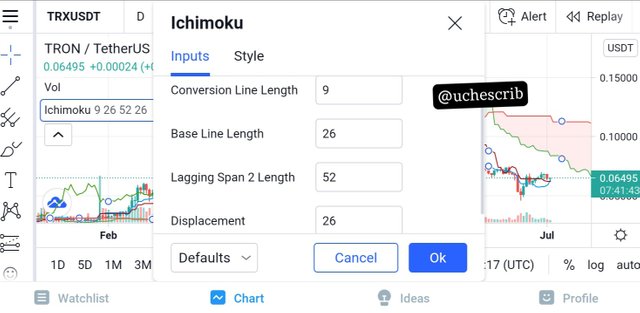
The Ichimoku has the default settings of (9,26,52). That is ;
- Tekan Sen: 9
- Kijun Sen: 26
- Chikou Span: 26
- Senkou Span A: 52
- Senkou Span B: 26
The default is (9,26,52) because Japan had 6 working days when this indicator was developed. "9" is the value for a week and a half (ie 6+3). "26" is the period for a week (ie 30 days of the month excluding 4 Sundays in a month; 30-4=26). "52" is the value for two months (ie 26×2=52).
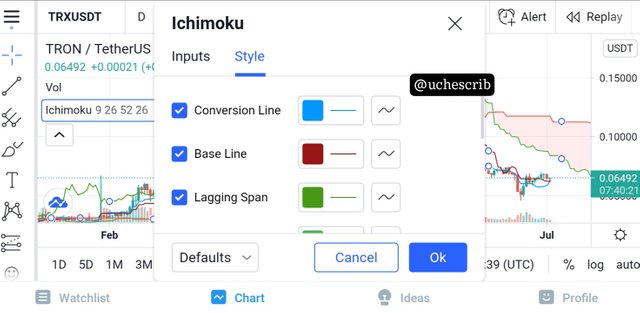
Style Tab:
The style tab simply includes the settings that are used to edit the indicator for visual preference. It includes line colours, line thickness, line type, and options to hide the components of the indicator.
Should these settings be changed.
Other popular settings are (10,30,60) and (20,60,80). The settings depend on the nature of the market in one's region and the preference of the trader.
Someone can experiment with a number settings and find a different setting to be more suitable for their own use than the original.
The (9,26,52) is merely the default settings. For other settings to have been formed, it means that people found something different which they preferred to the original. Nonetheless, the default settings still works for modern markets.
Using Tenkan-Sen Line
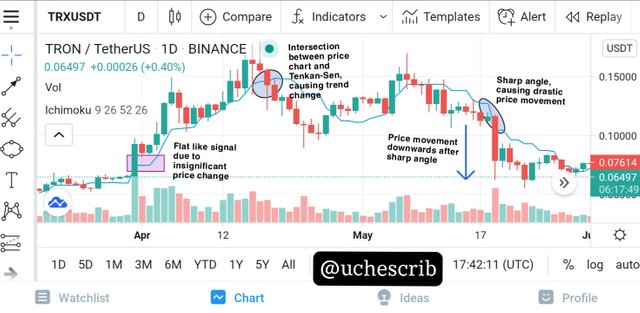
The Tenkan-Sen line is known as the fast line of Ichimoku Kinko Hyo indicator because it measures price volatility over a short term. The Tenkan-Sen gives flat line signals when there arr no significant price changes. These signals are used to determine support and resistance levels of a price chart.
As significant changes occur on the price chart, the Tenkan-Sen would also indicate such. It forms sharp angles if the price changes are very great, and obtuse or wide angles for slow price movement.
Also, the Tenkan-Sen is less likely to be influenced by little price changes because of its calculation method. As a result of this, it forms stronger support and resistance when compared to the SMA 9 (Simple Moving Average of period 9)
As the price chart gets closer to the Tenkan-Sen, it may signify a possible trend change. This condition should be confirmed with other methods.
Using Kijun-Sen Line
The Kijun-Sen is known as "the strong horse" of the Ichimoku. It gives the same data as the Tenkan-Sen but in a more accurate fashion. This is because it uses a longer time period (26 candles) for its function.
It shows more precise equilibrium points and better straight lines which are signals for insignificant price change. Great price movements are signalled by better slopes and sharper angles.
It is also best to use the Kijun-Sen line for placing stop loss orders because of its precision in market analysis. All these contribute to why the Kijun-Sen is known as "the strong horse" of the Ichimoku.
Using the Tenkan-Sen and Kijun-Sen simultaneously
The Tenkan-Sen and Kijun-Sen are both very useful when used individual, but using them together can still yield better results. First of all, the Kijun-Sen can be used to confirm signals given by the Tenkan-Sen because it is more precise.
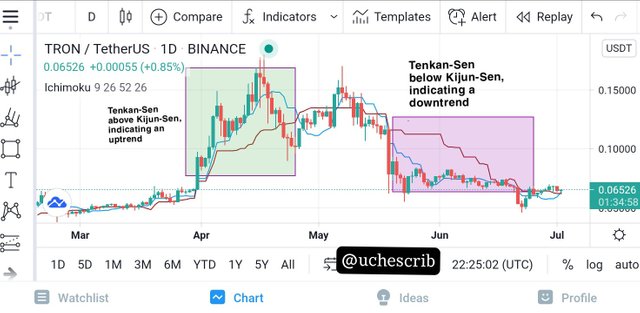
Also, both lines intersect each other during different market situations. When the Tenkan-Sen is above the Kijun-Sen, it is a signal for a very possible bull trend. On the other hand, the Tenkan-Sen crossing the Kijun-Sen downwards is a signal for a downtrend.
It is known that both lines cross the price chart individually at various times. Most times, the lines intersect each other before crossing the price chart. At other times, they intersect each other and the price chart at the same time. All these are early signals for a change in trend.
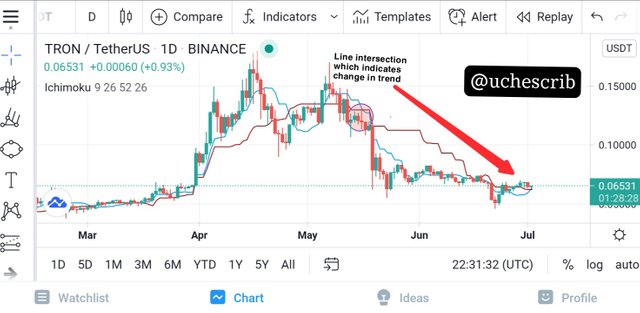
In the diagram above, notice how the two lines had already intersected each other before the Tenkan-Sen intersected the price chart . The intersection between the Tenkan-Sen and Kijun-Sen served as an early signal.
The Chikou Span Line
The Chikou Span is the line that gives a picture of the price chart, but is lagging with 26 periods. It's a very important component of the Ichimoku that is plotted 26 periods backwards from the current period, and it compares the past closing price behavior of a price chart with its recent closing price and shows possible trend reversals that may occur.
Intersection of the Chikou Span with the price chart is a very good signal. If the Chikou Span crosses the price chat towards the upward direction, it signifies an uptrend. When the Chikou Span is below the price chart, it signifies a downtrend.
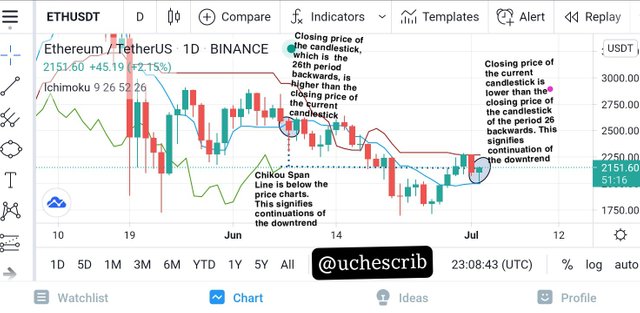
This component is also used by taking into consideration the closing price of the current candlestick and the closing price of the candlestick which is 26 periods backwards. It is illustrated below:
When using the Chikou Span Line, the following are important:
(A) Position of Chikou Span Line:
- Chikou Span Line above the candlestick chart indicates continuation of uptrend.
- Chikou Span Line below the candlestick chart indicates continuation of downtrend.
(B) Closing price of 26 periods back and Closing Price of Current Candlestick:
- Current closing price lower than closing price of 26 periods backwards indicates continuation of a downtrend.
- Current closing price higher than closing price of 26 periods backwards indicates continuation of an uptrend.
Why the Chikou Span is often Neglected
The Chikou Span is often neglected because it basically gives the current image of a price chart, but projects it backwards. Theres nothing special about it except that the current market value is lagging. Because it shows just the current market situation, it may not seem useful.
Also, using the Chikou Span to determine trends is not entirely reliability. It doesn't act as any sort of confirmation and can be misleading if used as the only method for confirming trends.
The image below shows an illustration of a situation where the Chikou Span can be misleading. It is observed that the market observed a majored decline in price before the Chikou Span crossed the price chart. If a trader waited in hopes that the Chikou Span would not cross the price chart, it would've been devasting. This is the reason why it is neglected by most people.
Best Timeframe and Indicator to use with the Ichimoku Kinko Hyo
Best Timeframe
The Ichimoku Kinko Hyo indicator can be used on any timeframe depending on the preference of the trader. It does not depend on a particular timeframe and can be used on any.
A short-term trader can successfully use this indicator on small timeframes such as a minute chart or something bigger like an hour chart.
Also, long-term traders can also implement this indicator on a long-term timeframe. A 4-hour chart, daily chart, weekly chart, etc are all suitable for the Ichimoku indicator.
Best indicator to use with Ichimoku
The Ichimoku indicator is known as an "All-in-one" indicator because it can be used independently. Nevertheless, it is always advisable to combine multiple indicators during market analysis.
The RSI is the best indicator to use with the Ichimoku. This is because the RSI is a momentum indicator that measures the speed of trend. It shows the extent that a trend would last. Overbought and oversold signals are also important in determining when to enter and exit a market, and when to expect trend reversals.
The RSI also shows divergence which indicates trend reversals. These signals would be given early by the RSI even before the Ichimoku would show possible signs.
Conclusion
The Ichimoku Kinko Hyo indicator which translates to "The Balance Chart From One Look" has proven itself to be very useful. It has lived up to its name as The "All-in-one" indicator because of its ability to detect trend reversals, trend continuation, strong support and resistance, and it's overall efficiency in decision making.
The Ichimoku has five components which are; Tenkan-Sen, Kijun-Sen, Senkou Span A, Senkou Span B, and Chikou Span. The Cloud is also a component which is identified as the enclosure formed between the Senkou Span A and Senkou Span B. These components are what constitute to making the Ichimoku a very formidable tool.
Special thanks to @kouba01
Hello @uchescrib,
Thank you for participating in the 1st Week Crypto Course in its third season and for your efforts to complete the suggested tasks, you deserve an 8.5/10 rating, according to the following scale:
My review :
A good content work in which the topic was covered in all its aspects through accurate answers and a clear methodology based on illustrations that you did not use to extract the signals emanating from the use of Kijun-Sen line, as well as for the preferred time frame and merging the indicator with another indicator.
Thanks again for your effort, and we look forward to reading your next work.
Sincerely,@kouba01
Thank you prof