Confluence Trading and its Benefits- Crypto Academy / S5W6- Homework Post for @reminiscence01

Greetings everyone. It is a pleasure to be a part of this week's Crypto Academy. This week's lesson is focused on confluence trading, its benefits and how to apply the technique. Without any hesitation, I would tackle the given tasks.

Confluence Trading
So many methods or techniques have been developed for price analysis of a crypto market. These techniques can be used individually to make decisions, but this isn't the best strategy for trading.
Confluence trading is the combination of techniques for technical analysis of a crypto asset. It could be a combination of pattern techniques and technical indicators or just a combination of technical indicators.
The combination of technical analysis techniques improves the chances of making profit out of the crypto market. As a result of this, it is the best and safest market analysis strategy.
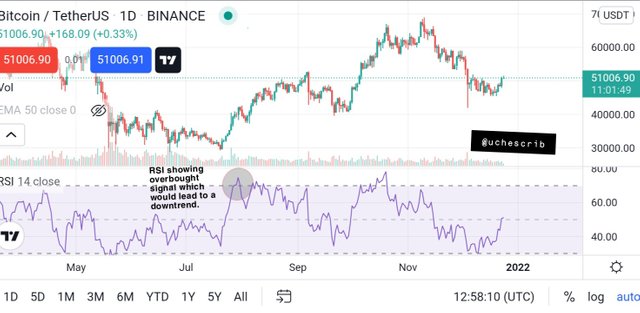
The image below shows a scenario where a technical indicator gives a false signal. The RSI shows a signal in an overbought region. The RSI line is above the 70 mark which signifies that a downtrend is about to occur.
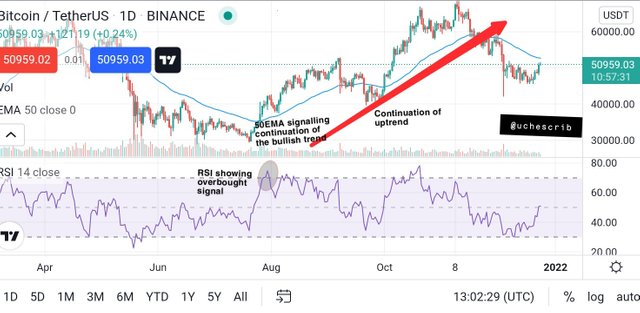
As the 50EMA was incorporated into the chart, it is observed that there were no chances of a downtrend occuring. The EMA acts as dynamic support to the price movement and the closer it gets to the price chart, the greater chances of a reversal. It is observed that price continued in an uptrend despite the signal given by the RSI. This displays how confluence trading is used to enhance trade setup.

Importance of Confluence Trading
Now that we have seen what confluence trading is, it is okay to say that this trading strategy is very important to traders in the crypto market. This strategy has proven to be beneficial in the following ways:
Confluence trading helps traders in making confirmations of signals given by indicators in a crypto market. As more than one indicators are being used, each signal given by an indicator would be confirmed the others.
Confluence trading improves the overall trading strategy of a trader because it boosts confidence in trading. When signals are confirmed, the chances of winning a trade is always high.
Confluence trading helps in filtering fake signals given by an indicator. Just like in the illustration given above, the incorporation of another indicator can be used to filter a false signal given by another.
The practice of confluence trading has proven to be a good risk management strategy. The ratio of gains to losses would be very high with this trading strategy. Confluence trading helps to reduce the chances of a loss in crypto trading.

Types of Confluence Trading
The confluence trading strategy is of two types namely; 2-level Confirmation Confluence Trading and 3-level Confirmation Confluence Trading.
2-level Confirmation Confluence Trading
2-level confirmation confluence trading is the combination of at least two trading market analysis strategy in a trade setup. Let's use the first chart above as an illustration.

The RSI was the initial indicator that was brought into this chart. It is known that RSI is a momentum indicator and this means that it can measure the extent to which a trend has reached by determining overbought and oversold regions.
In the chart above, the RSI signalled an overbought region which signifies that a trend reversal would occur and the bearish trend would begin. The 50EMA is used to filter this signal as it shows that there is no possibility of a bearish trend in this scenario.
If a trader placed a trade at the point of the overbought signal, he would be left with a loss.
3-level Confirmation Confluence Trading
3-level confirmation confluence trading is the combination of at least three trading market analysis strategy in a trade setup.
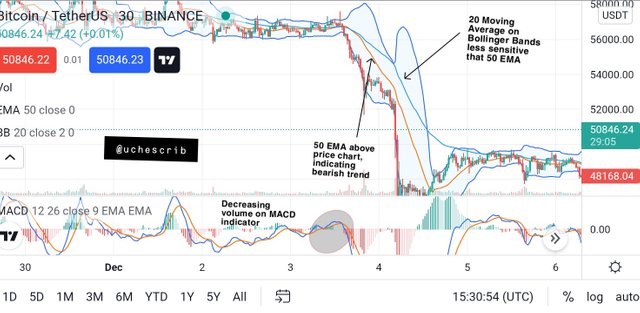
The image above illustrates the 3-level confirmation confluence trading strategy. The price chart is the chart for BTCUSDT. The MACD indicator showed decreasing volume at the marked point which indicated an approaching bearish trend. We observe that the market was initially in a ranging market, meaning that no trend was defined.
The 50 EMA was incorporated into the chart because it has little sensitivity to price movement (meaning that little changes in price would not affect the position of the 50 EMA). The 50 EMA crossed the price chart and formed dynamic resistance as the bearish trend began.
The Bollinger Bands was also incorporated to further confirm the bearish signal. The 20 MA of the bearish trend is less sensitive to price, making it a good confirmation to the signal given by the 50 EMA. All signals were hinting to bearish trend which was the result eventually.

Demo Trade using Confluence Trading
Demo 1
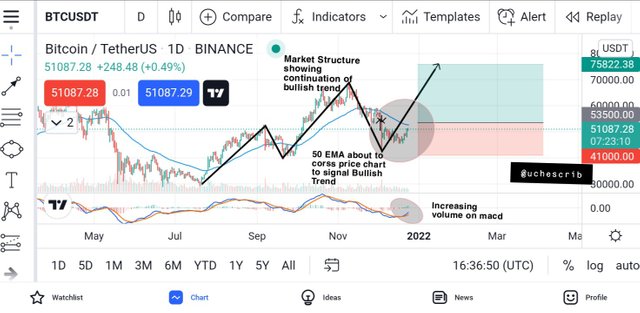
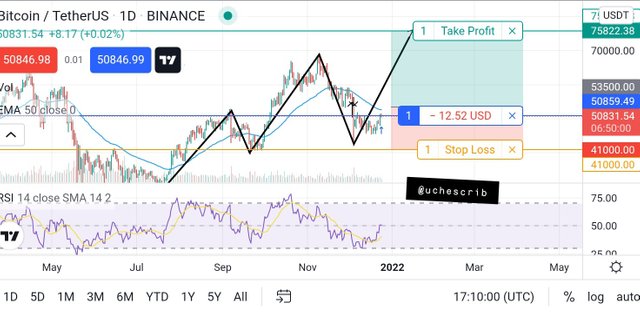
The chart above shows the BTCUSDT chart. Market structure signals that the price is in an uptrend currently. This is seen by price forming higher highs and higher lows. The price is currently recovering from a retracement.
The MACD shows rising volume, indicating an uptrend. The 50 EMA also shows a sign of crossing the price chart to move upwards, which also signals a coming uptrend.
I placed my buy entry at 53500.00 because I'm predicting that the EMA would cross at that point. My stop loss is set at 41000.00 and my take profit point at 75822.38.
Demo 2
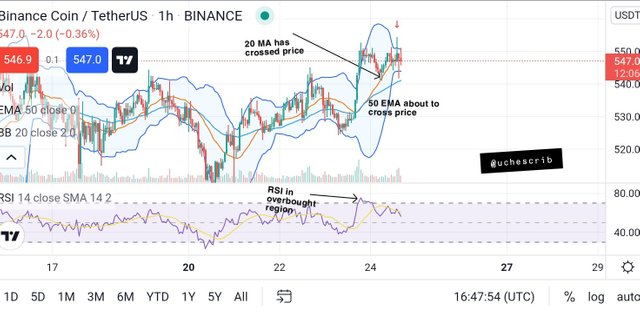
The chart above shows the BNBUSDT price movement. Price is currently in an uptrend in the chart. The RSI indicator shows an overbought region which is a signal for an approaching downtrend.
I incorporated the Bollinger Bands and the 50 EMA as a confirmation for this signal. The 20 MA of the Bollinger bands has shown signs of crossing the price chart although it is less sensitive than the 50 EMA. This signals a bearish trend.
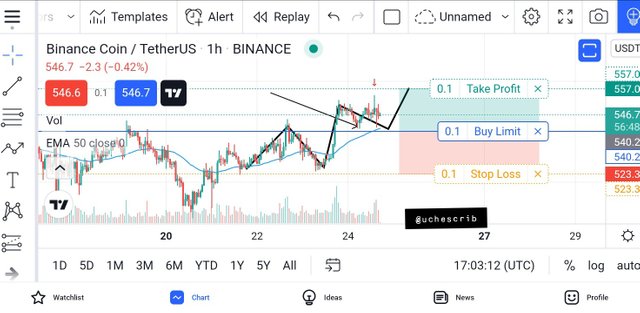
I placed a buy entry at 540.2. My stop loss is set at 523.3 and my take profit point set at 557.00.

Conclusion
Countless number of technical analysis techniques have been developed over the years but the best method of technical analysis still remains the confluence trading strategy.
This strategy confirms signals from other techniques and helps filter errors. There are other benefits to this strategy and they can be explored as a trader puts it into practice.
Cc: @reminiscence01