Steemit Crypto Academy Season 2 Week 6 Homework Task By @tymes2 : Technical: Reverse Strategy | Crypto Prices & Market Source: Review Of COINGECKO.
INTRODUCTION
Hello steemians, I am very delighted to write my homework post for this week and also using this opportunity to say a very big thank you to prof @stream4u for this wonderful lecture this week.
Question 1
Technical Details On Reverse Strategy
Reverse Strategy is a context that wants to talk about a trend and how it was reversed in the long run and as such, Reverse Strategy is a strategy employed in the technical analysis of cryptocurrency to detect an extremely bullish or bearish of a crypto market before making an investment decision to properly take advantage of the prolonged bullish or bearish trend. Reverse strategy shows us when we must invest or gather a quantity of cryptocurrencies to obtain a profit. When a crypto asset is in a bearish or bullish level for a long period of time it produce a unique situation where there is a high number of trades. Although, we should not make decisions during these bearish and bullish periods because a prudent decision brings with it an uncertain situation.
How Reverse Strategy Works
In this kind of a situation whereby the crypto market is in a long bullish or bearish trend the reverse strategy turns to work out for investors to gain good positions in trading process. That is we have some points and price points we need to take note here.
- Opening price
- High Point
- Low Point
- Close Point
When we talk of the opening price it is simply the starting point of the reverse strategy which is most close to the previous Closing price. That is, the strategy solely depends on the closing and opening points or prices in the day. To gain a good buy position, the opening price should be closer to that of the previous closing price. This will give the investor a good position to buy. On the other hand, a good exit of the trading process will be depend on the high points and low points. In a situation where the price of a particular crypto asset gets to previous high point and the investor is able to hold on till it crosses that previous high point, It is a good position for the investor to exit that trade.
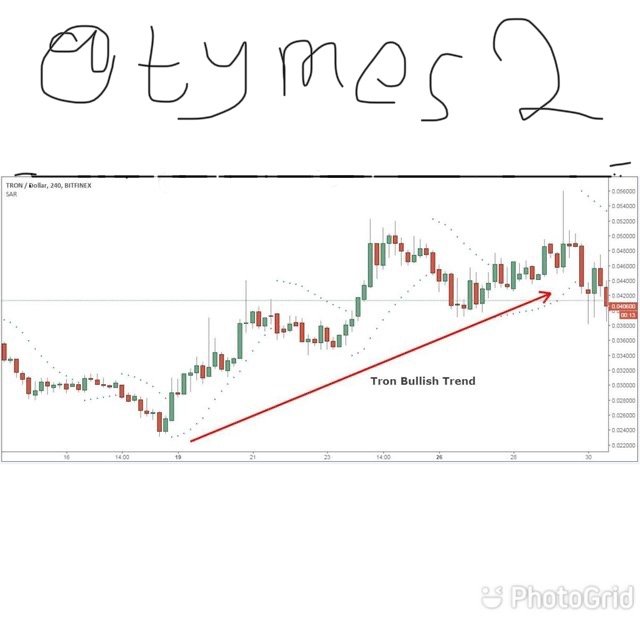
The screenshot below shows A Reverse Strategy On TRX/USDT Pair
REVIEW OF COINGECKO
CoinGecko is basically a platform that provides all the necessary information of all cryptocurrencies coins in the crypto market. That is, it provides to it's users all the technical and fundamental details of the crypto market.
It is also used in the tracking of various cryptocurrencies in the crypto market. It was created by TM Lee and Bobby Ong in the year 2014. CoinGecko also gives information to it's users on the volume, price value, capitalization and many more about cryptocurrencies in the crypto market. In CoinGecko, various cryptocurrencies are arranged based on the capitalization of the market. It also goes further to provide the performance of particular cryptocurrencies in the market.
https://www.coingecko.com/en its the link that is used to CoinGecko.
Question 2
Review Of CoinGecko
What Is CoinGecko
In simple terms, CoinGecko is a platform created to keep the track of different digital currencies and get various informations about the cryptocurrencies. It was created by TM Lee and Bobby Ong in the year 2014 and it is based in Singapore. Cryptocurrency users gets their needed detailed information about the cryptocurrencies assets they are holding on the coinGecko site, which allows them to analyze the best ones for different purposes. There are several information that the CoinGecko site gives so to investors and some of these information includes; the exchanges available, crypto market capitalization, volume of different cryptocurrencies, different analysis and many more.
Moreover, the value in terms of price are been listed down in an order in CoinGecko, this is carried out by the market capitalization of the cryptocurrencies which also aids individuals to know the how far of cryptocurrencies.
How COINGECKO Can Be Helpful For You In A Crypto Market
There are many ways the CoinGecko platform can use by its users and below are some of the ways;
- Volume and Historical Chart: Every crypto asset has its volume in the crypto market which are easily seenon the CoinGecko site and with the historical charts, they are shown such that it helps its users to check the market behaviour of a crypto asset over a period of time.
Rank and prices of Crypto assets: The prices of different crypto assets are shown on the CoinGecko site and that of the position by the market capitalization which helps an investor ( traders) to make research on how a crypto asset is performing in the crypto market.
Performance Evaluation: The Coingecko site gives detailed information about different cryptocurrencies by showing their performance in the crypto world and this would help an investor to make a good decision as to which crypto asset have a wonderful future.
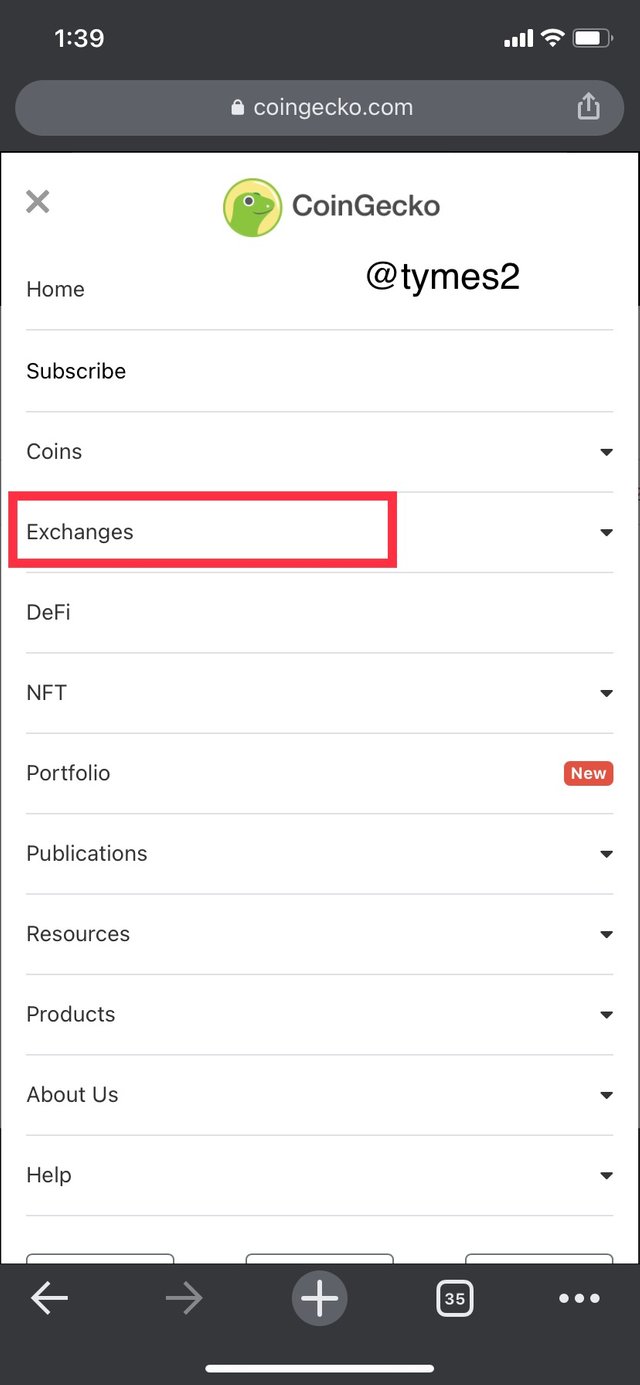
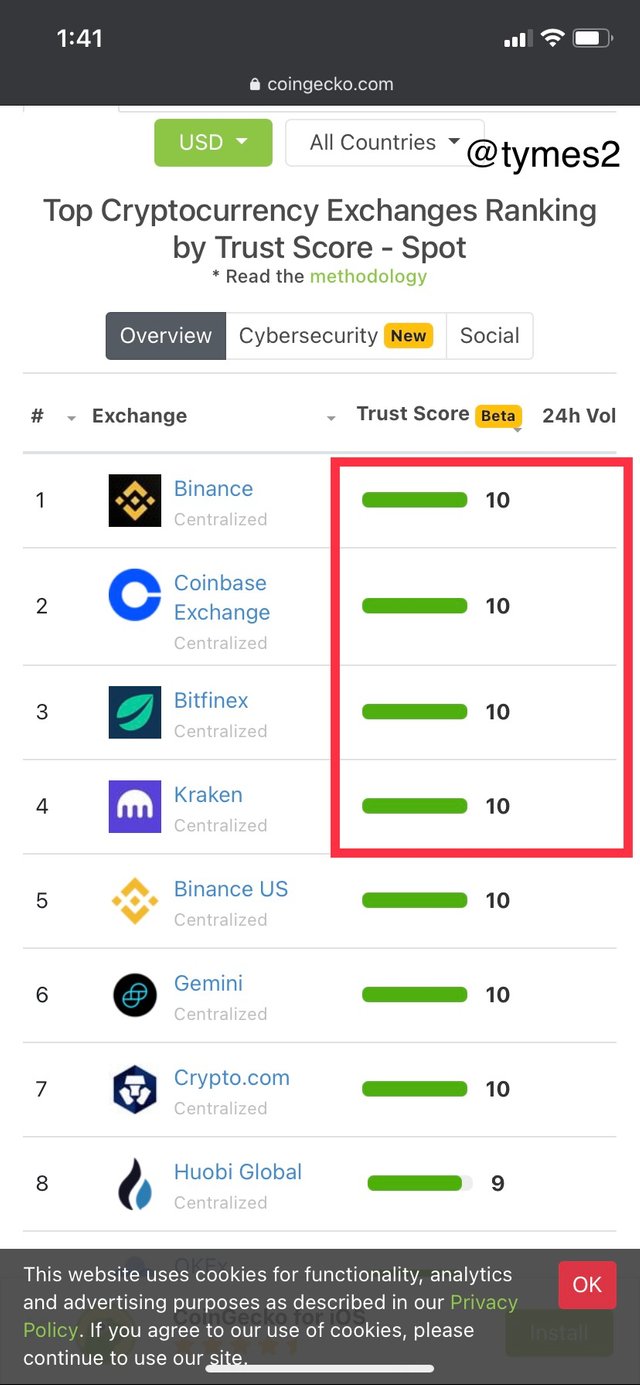
Exchange
This is one of the features in CoinGecko that I will be looking at. That is with this feature, the user is given the opportunity to chose the preferred service from the menu that appears. They are Spot, DEX, Derivatives and so on.
The Spot option provides information on spot services.
The Derivative option also provides information on exchanges the gives contract trading.
The DEX option on the other hand gives information on the list of decentralized exchanges.
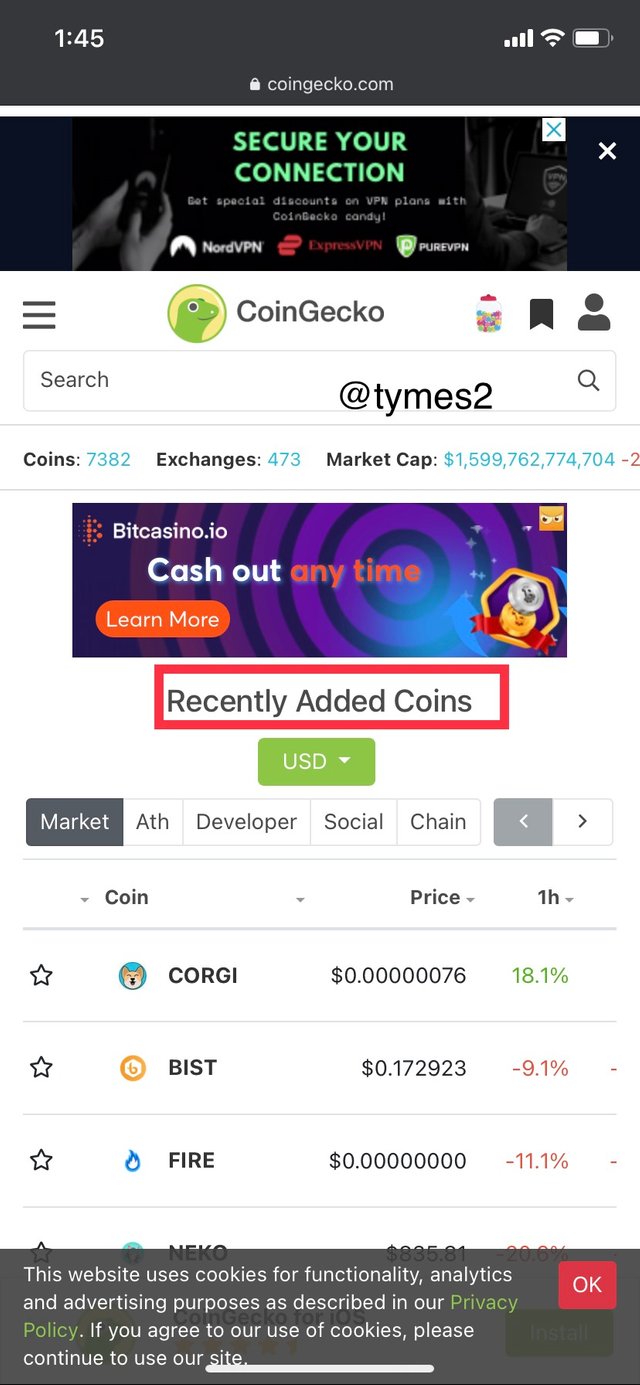
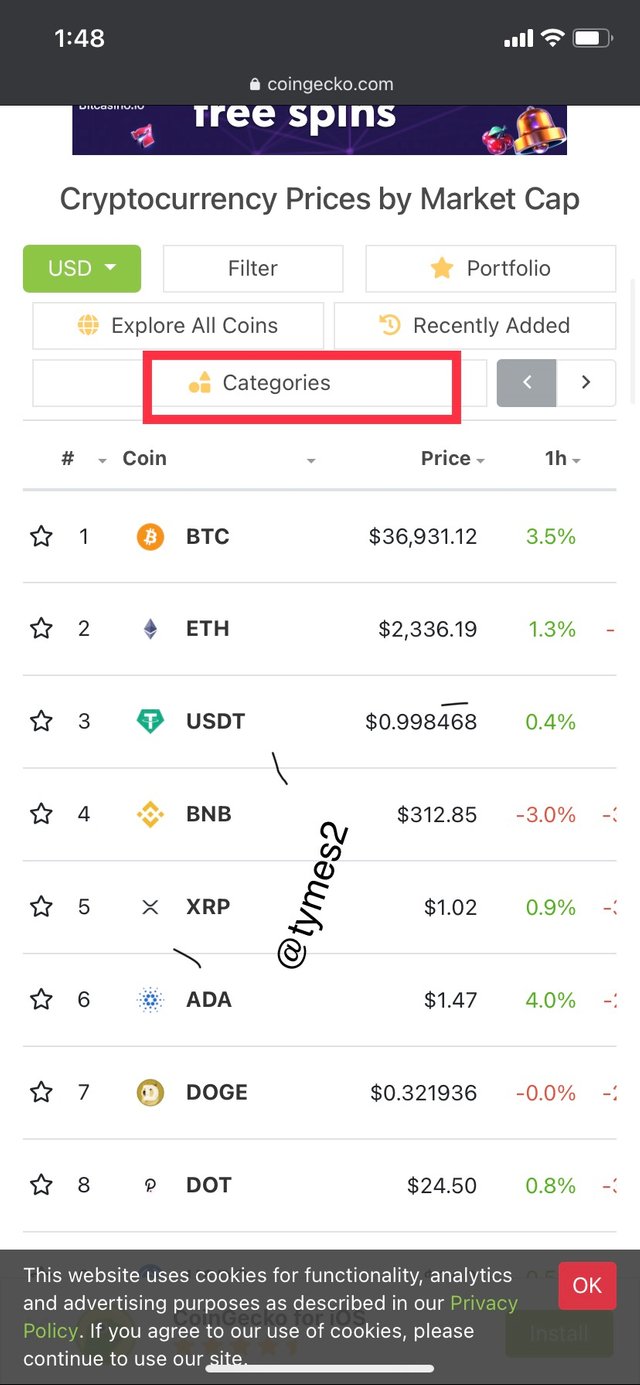
Recently Added Coins: With this feature a user can easily check on the recently added coins and the below screenshot shows the coins that were added recently.
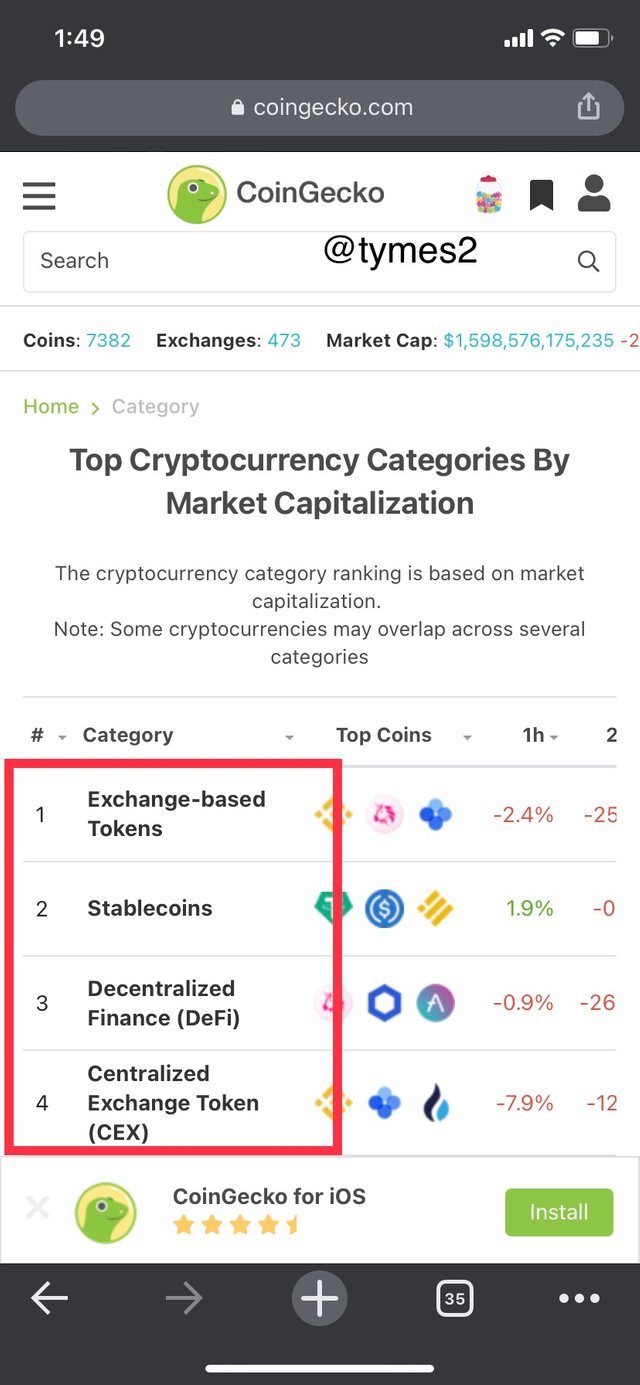
Categories: From the homepage of the CoinGecko site, you can select categories and it is to arrange crypto assets type. The available categories on the list are; Exchange-based tokens, Decentralized Finance, Centralized Exchange token, Binance smart chain ecosystem etc. Each category of the tokens have top coins in each section with market capitalization, the ranking by market capitalization and the price behavior.
Developer
This feature on CoinGecko provides the information on contributions made by developers in a way of making changes to the project. This will enable them to make the website a better one. This feature is made available by Top 100 coins in the Trading Volume.
Crypto assets by market cap: Crypto assets prices can be arranged with regards to the market capitalization which shows the rank of each crypto asset, their prices, market capitalization, trading volume and so on.
Chain: With the chain feature, it shows which algorithm is used, which block, which node and the amount tokens circulating on the crypto market and the amount left as well.
Question 3
Weekly Price Forcaste For Crypto Coin Tron
For this study, I’m to use Tron coin and I choose it because this crypto asset has a wonderful uptrend in the recent time. Over the last few weeks before the downtrend, Tron has a great market price behavior.
What You should Know about the Tron
TRX is the native token of the Tron network which was launched in 2017 by Justin Sun. The Tron blockchain system has changed several things in the blockchain technology, it brings about free transactions on the blockchain.
All tokens on the Tron blockchain are considered TRC20 tokens. The current price of 1 TRX is equal to 0.1132 USD and TRX is ranked 22nd by market capitalization with the total market cap of $8,111,298,890.35 and the circulating supply is 71,659,657,369 TRX, and I had all information from the coinmarket cap.
Reason Why I Choose The Tron Coin
There are so many reasons why I choose TRON Coin but below are some of the reasons why I choose it;
- A free digital platform that enables users to share digital contents free with no attached charges.
- Transaction speed of up to 2000 transactions processed / second.
- Low transaction fee on the Tron network.
- Compatibility with smart contracts.
Technical Analysis Of The Tron Coin
I will like to look at the price behavior of TRX/USDT compare and predict it’s price in the coming one week. In this analysis, I will also like to be checking on supports and resistance levels in the previous days and weeks which has forced a trend reversal. I am using this strategy today to get involve the new topic i have learnt in this week lecture to see extreme bullish and bearish price behavior of the asset and to see points where there was reversal trends and draw out my support or resistance levels to predict the price of TRX/USDT in the next one week.
We can see that the upper trendline at $0.0272, which coincides with the 50-SMA, is acting as a robust resistance level that the bullish trend need to break and the MACD has maintained bullish since October 9th and seems to be gathering some momentum. However, the Bollinger Bands are incredibly tight as it stands, with the upper band acting as resistance also. Now a breakout above the upper boundary will lead the price of TRX to $0.032.
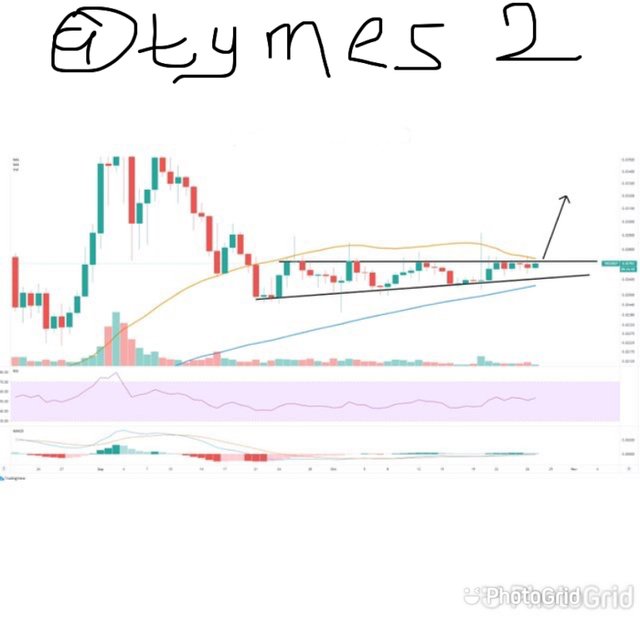
On the other hand, another rejection from the critical resistance level at $0.0272 can be a good opening for a strong selling signal. As we can see below on the 12-hour chart, the 100-SMA coincides with the upper boundary of the rising triangle trend. Moreover, as the price is approaching the resistance level the MACD seems to be on the verge of turning bearish. Now the bearish price target would be $0.026 and as low as $0.021, which is the the 100-SMA on the chart.
My Output Technical Analysis On The Tron Coin
Per-by my research, I have the following information to show the estimates from the chart pattern of the TRX/USDT pair. And the technical analysis was based on the price history of the Tron coin noting the supports, resistances and reversal trends over time to make a price forecast for the asset in the next one week.
Now with the study i have carried out, i will say In the next one week, the next low will be 0.09998 USDT, the next high will be 0.13918 USDT and also, there could be a breakout at 0.13918 USDT and attain 0.16988 USDT.
Conclusion
I will like to use this opportunity to thank the professor @stream4u for his wonderful lecture this week. I really learn a lot from his lecture and I hope my homework task will be accepted and review thank you!!!!
Thank you for joining The Steemit Crypto Academy Courses and participated in the Homework Task.
Thank you very much for taking participate in this class and keep continue good work and gain good grade
Grade : 7
Thanks prof