Trading Strategy with Median Indicator - Steemit Crypto Academy |S6W4| - Homework Post for Professor @abdu.navi03

Greetings friends, hope we're all doing good. Today, I wish to enroll my homework with regards to the assignment of Professor @abdu.navi03 and below are my contributions to the questions.

1-Explain your understanding with the median indicator.
The median indicator like most other chart based indicators, is a good technical tool that is used in price prediction. This indicator tries to ascertain market volatility using its average true range (ATR).
Nevertheless the ATR of this indicator is plotted above and beneath its MA. The line of the median indicator also acts as EMA which helps it in determining market volatility and probable trend signals.
Moreso, the median indicator also has two default clouds which are purple and green. The greenish cloud indicates a short or long bullish position while the purple cloud indicates either a short or long bearish position.
2-Parameters and Calculations of the Median indicator. (Screenshot required)
The screenshot below shows the parameters of the median indicator
Input
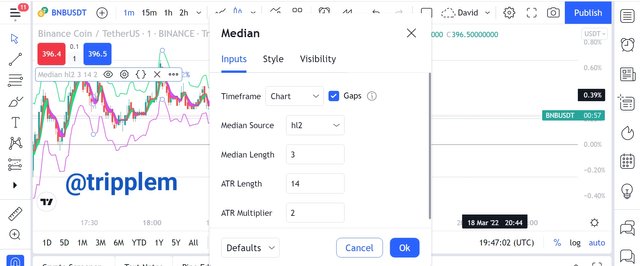
From the screenshot above, this indicator has a default setting of median length 3, ATR length 14, ATR multiplier 2.
These values can be altered but discreetly to suit a trader's position. Nevertheless, a wrong alteration of these figures can cause a malfunctioning of the MI.
Style
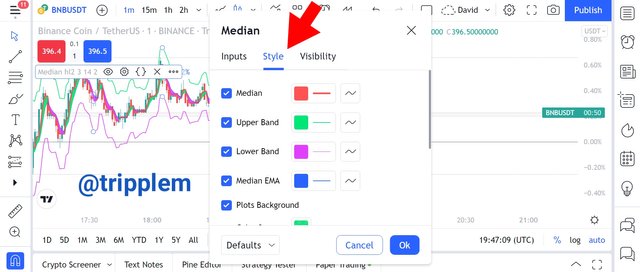
We can view the style setting of this indicator from the screenshot above although this part is not that important as compared to the input side as it can be altered based on a traders preference.
Calculation of the MI
I can put it that, possibly all the indicators derive their positions from the statistical calculation of different time series, using values like high, low, opening and closing prices of assets which the median indicator is not in exemption. Nonetheless, below are the parameters and possible calculation of this indicator.
To be able to calculate the median indicator a trader has to consider the following:
ATR: by default, this represents 14 periods.
ATR MULTIPLIER: this is multiplied by the ATR in the form of the lower and upper band using a default value of 2.
Nevertheless the values above represent the default setting of this indicator which can be modified at a traders discretion.
For a real calculation of this indicator one has two:
Calculate each candle average = (high position + low position) ÷ 2
Next, sum all 14 period averages ÷ 14
Assuming that the average positions of a particular asset are: 2, 4, 6, 7, 3, 12, 11, 3, 6, 7, 4, 3, 4, 5
Next MI=2+4+6+7+3+12+11+3+6+7+4+3+4+5 ÷ 14
MI= 77÷14
MI=5.5
3-Uptrend from Median indicator (screenshot required)
Like the uniqueness of most indicators, the MI also stands unique in its own way. Nonetheless, the signs displayed by the EMA and the cloud of this indicator signals what the current trend might be.
In an uptrend, The EMA and the green cloud stays put below the price chart and this could last for a short period or possibly a longer time while it signals a market entry for a buy position and this could be seen from the screenshot below.
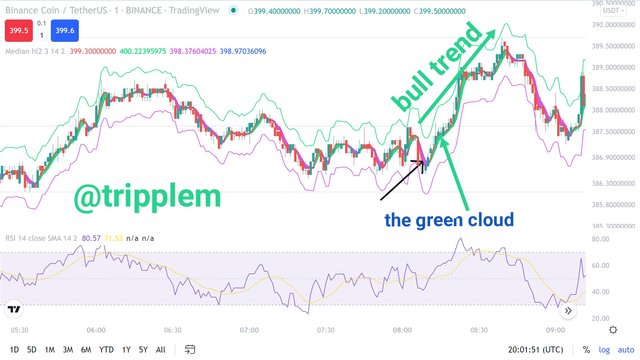
From the above screenshot, we can agree to the bullish position as the EMA of the MI positions below the greenish cloud without an obvious display of the purple cloud which could have altered the uptrend position till the reversal point was spotted.
4-Downtrend from Median Indicator (screenshot required)
For a down trend to be confirmed in this indicator, the EMA of the MI has to go above the purple cloud while acting as a resistance to the price chart. Furthermore, this could be for a longer or a shorter period as we can confirm this from the screenshot below.
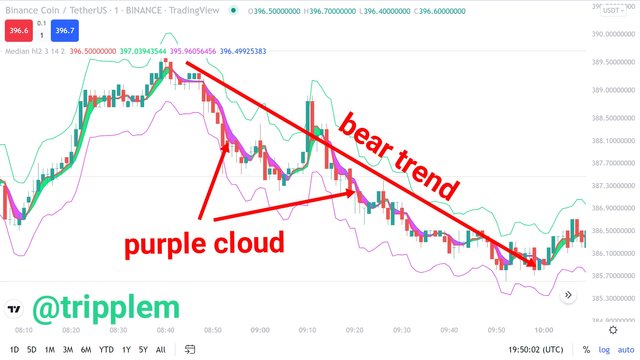
From the viewed screenshot, we can spot the strong purple cloud above the price chart, moving along with the EMA in a bearish direction and hence traders can open a sell position in this market scenario.
5-Identifying fake Signals with Median indicator(screenshot required)
Fake signals are very common with indicators because of the high volatility nature of crypto assets which causes different indicators to act abnormally in certain market scenarios and the same applies to the MI but with a good understanding of the market operation, these fake signals can be identified and I will be illustrating this using the screenshot below.
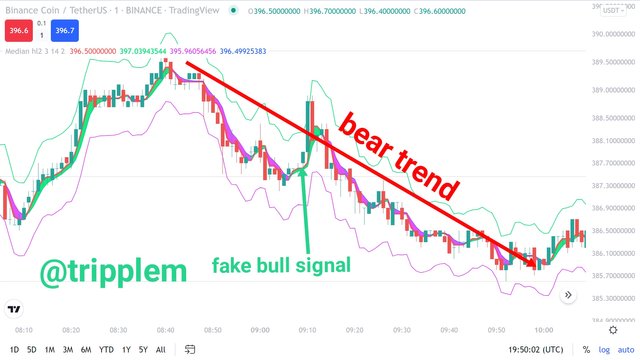
From the screenshot above we can observe how the MI made a greenish cloud spot while the indicator was still in a bear position as this shows that the viewed position was only attempting to retest the previous lower low and not possibly taking a reversal, this really shows a fake signal by the MI indicator.
6-Open two demo trades, long and short, with the help of a median indicator or combination that includes a median indicator (screenshot required)
In this instance, I will be pairing the USDT with the BNB in a buy trade while pairing with ETH in a sale using paper trading on trading view.
buy trade using BNB
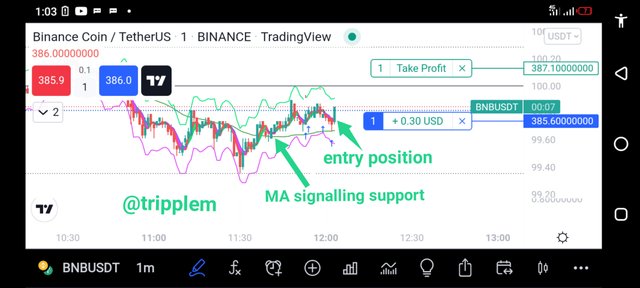
From the screenshot above, I entered the market after spotting the strong bullish candle and also the little green cloud of the MI which signals a Bullish direction and also with the help of the MA which gave a strong support to the trend.
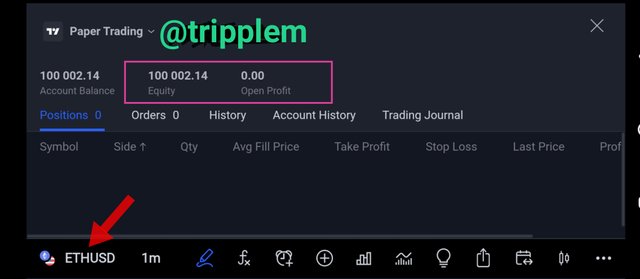
Wallet evidence after trade

Sale trade using ETH
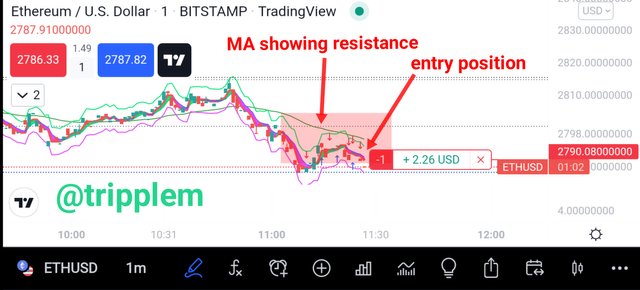
From the screenshot above, I entered the market for a sell trade after the trend made a lower high by retesting the previous lower lower and hence it indicated a full purple cloud which signals a bear position. Hence with the help of the 100 MA which tried reinforcing the trend, I was fully convinced to make a sale trade entry.
Wallet balance after trade
This Indicator has a good position of generating profit to traders if used wisely especially if the two clouds are properly followed both in the bull and bear position.
But we still have to bear in mind that no Indicator is 100% perfect for placing trades though it can be helpful to a certain extent and such, other indicators which a trader is acquainted with should also be deployed for profit optimization. Thanks to Professor @abdu.navi03 for such a wonderful exposure.