Crypto Trading with Moving Average ]-Steemit Crypto Academy | S6W2 | Homework Post for @shemul21

Hello friends, I'm happy to be participating in this week's lecture as taught by Professor @shemul21. Thanks for patiently going through my contributions below.

1 Explain Your Understanding of Moving Averages.
Moving Averages are technical indicators which are employed by stock analysts in spotting different resistance and support
levels of price action which can either lead to up or downtrend in the market.
This is also used frequently in streamlining the different average prices of stocks at specific market periods
Nevertheless, the lagging nature of the moving averages makes it imperfect in absolutely and accurately predicting market trends, on the other hand, in trend confirmation, we can observe the price action crossing over the MA. Hence in a downtrend scenario, the price action has to go below the MA while in a bull trend, the price action goes above the MA although this also depends on its settings as the above exertion is compatible to higher length of the MA like 50,100, 200 period length.
2 What Are The Different Types of Moving Average? Differentiate Between Them.
The different types of moving averages are viz Simple Moving Average (SMA), Weighted Moving Average and Exponential Moving Average (EMA) and these MA's will be explained below.
Simple Moving Average (SMA).
This type of MA sums the random estimation of a range of price action indicated in a set of charts periodically.
Although the SMA can be used as the EMA but on the other hand, the movement of the SMA is slower compared to the EMA. Hence the SMA can be calculated using the formula below.
Formula for SMA
SMA= ( p1 + p2 + p3….pn ) / n
Where all the P's are random prices of a particular asset.
n= number of periods in view.
Let's take an instance on how this works using the following figures below.
Assuming that the price of a particular asset is randomly selected as shown below.
( $5, $20, $25, $30, $35 )
SMA= 5+20+25+30+35÷5
SMA=$115÷5
SMA=$23
Though this is for an estimated average of 5 periods, as this may change with regards to different time intervals.
Exponential Moving Average.
The EMA also is a lagging indicator that majors on current asset prices which makes it to be a bit responsive to price action when compared to the SMA. The EMA can be used in randomly selecting and estimating the average price of an asset over a particular period, probably 100, 200 etc.
Formula for EMA
EMA= t * k + y * 1 - k
Where t= today's price
k= 2 / (N+1)
y= yesterday's EMA
N= no. of days of EMA
Let's now check into how the EMA works using the example below. Let's assume a particular asset with the following values.
t= $200, y= $300, N= 100
EMA= (200) x 2 ÷ (100+1) + 300 x ( 1 - 2 ÷ (100 + 1)
EMA= 400 ÷ 101 - 300 ÷ 101
EMA= 3.96 - 2.97
EMA= $0.99
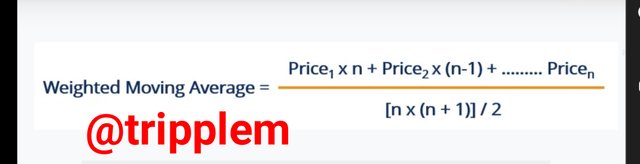
Weighted Moving Average WMA
This moving average is the fastest of all the moving averages, as it responds more quickly with regards to price action when compared to the other two moving averages explained above, this is also used by traders in generating possible trend movements. Like the other moving averages, when the price action moves below the WMA, our most expectation should be a downtrend and on the other hand, when the price action moves above the WMA, a bull trend should be expected.
Formula for calculating the WMA
Steps in estimating the WMA
Step 1.
Identify the asset values you want to average
Step 2.
To determine the weight of each of the values you want to average
Step 3.
Multiply each number using the weighting value
Step 4.
Add all the factors together to get the WMA
Let's take an example to illustrate how the WMA works.
If the identified closing price of a particular stock from January 1st to Jan. 4th was $2, $4, $6 and $8, and their weighted value is 10 respectively.
Using the above value, let's now solve for WMA.
Step 1.
The identified values are: $2, $4, $6 and $8
Step 2.
The weighted values are: 2/10, 4/10, 6/10, and 8/10
Step 3
We now multiply together, the identified values and the weighted values to get the WMA
| Date | Identified value | weighted value | product |
|---|---|---|---|
| Jan. 1 | $2 | 1/10 | $0.2 |
| Jan. 2 | $4 | 2/10 | $0.8 |
| Jan. 3 | $6 | 3/10 | $1.8 |
| Jan. 4 | $8 | 4/10 | $3.2 |
Step 4
We now add up all the products resulting from the calculation above.
0.2 + 0.8 + 1.9+ 3.2 = $6.1
WMA= $6.1
Major differences between these MA's
| SMA | EMA | WMA |
|---|---|---|
| This weighs all the chosen values with equal importance, although it is the slowest moving average of all the other averages. | This places importance on the most current asset values while considering older asset values with same importance and it is slower as compared to SMA | This weighs importance on most recent asset values and less importance on previous values on the other, this is the fastest moving average of all the other ma's. |
Let's consider the screenshot below to see the market action towards these moving averages using 20 periods.
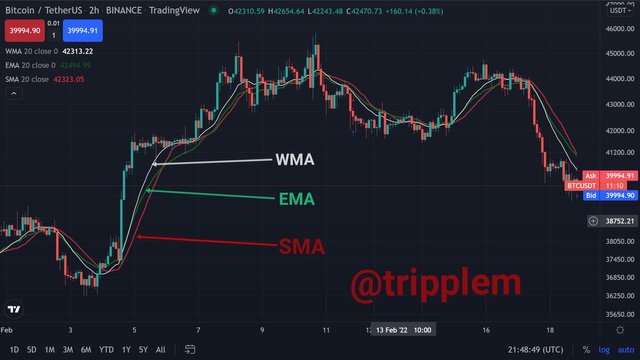
From the screenshot above, we will observe that the WMA is faster with response to price action, then followed by the EMA and lastly the SMA which is the slowest of all the ma's
3 Identify Entry and Exit Points Using Moving Average. (Demonstrate with Screenshots)
Entry and exit points in the market are caused by two factors which are buyers and sellers. Hence when there is an excess demand of an asset, the next market reaction should be an increase in price while an excessive layoffs plunges the market into a bear trend.
Nevertheless, these factors that affect the market which are buyers and sellers can be represented using the MA.
In a situation where there is more buying pressure in the market, the price action moves above the MA thereby initiating a real Bull market.
On the other hand, an excessive sell order plunges the price action below the MA thereby causing a decrease in price.
Finally, I will be identifying the entry and exit positions using the screenshot below.
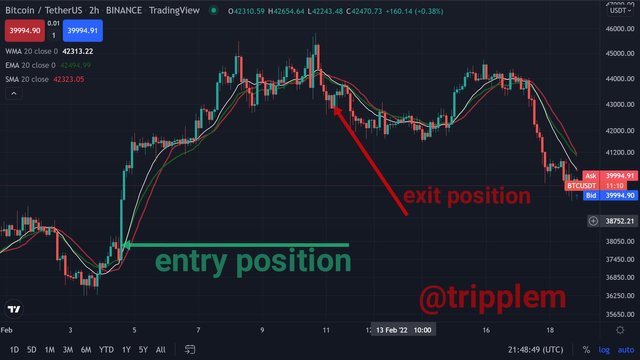
From the BTC/USDT screenshot above, we can observe the entry position after the price action moves above the MA and hence an exit position at the position the price action moved below the MA
4 What do you understand about Crossover? Explain in Your Own Words.
Crossing of the moving averages involves the action of two or more MA's of which one of the moving averages should be a slow one (100 or 200) while the other should be a fast one (7, 9, 14 etc).
Nevertheless, when the fast moving average crosses the slow moving average from below, the expected trend of price action should be an uptrend while in a situation whereby the fast MA crosses the slow MA from the top, the expected trend should be a downtrend.
Finally, we can observe this instance from the screenshots below using a 9 and 100 length period first in a bull trend.
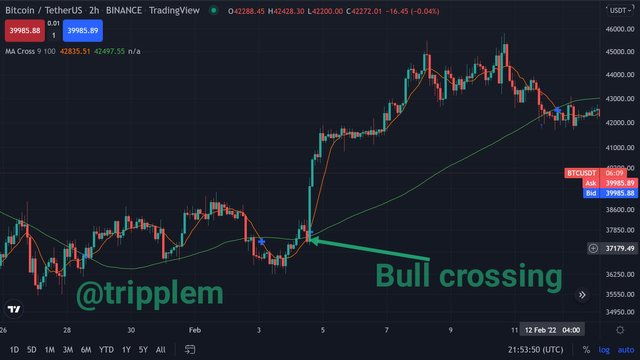
From the BTC/USDT screenshot above, we will observe that as the 9 period MA crosses above the 100 MA, a bull trend was automated.
Next, let's also scrutinize the crosses of the ma using the BTC USDT chart below with regards to a bear trend, also using 9 period and 100 length period.
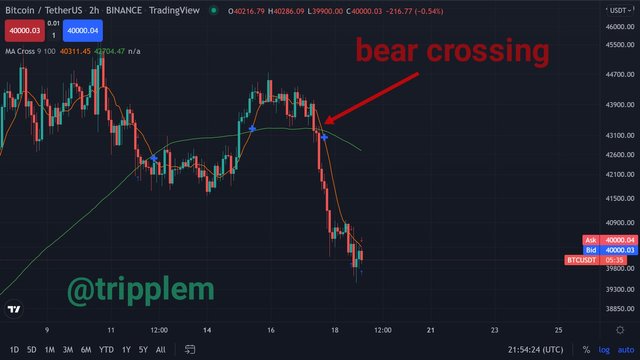
From the above screenshot, we will observe that as the 9 period MA crosses from the top to the bottom of the 100 MA, the observed trend turns to bear.
5 Explain The Limitations of Moving Averages.
The following are some of the observed limitations of the moving averages.
This is a lagging indicator whose values do not have what it takes to predict future prices action.
This indicator can create a lot of false signals if solely used as no indicator has an absolute capacity to be traded solely for profit maximization.
During a sideways movement in the market when there is no real trend, the moving average may not work very perfectly with regards to the movement of price action.
In periods of low market volatility, the moving average may not produce a true and reliable signal for traders to trade with.
The fast moving average may produce a lot of false signals if solely used and on the other hand, long term traders may not benefit from the use of the fast moving average.
A good knowledge of the moving average can be of great help to professional traders who are acquainted with its use, although beginners can also benefit from its use based on the commitment in learning to use it.
Despite establishing that once the price action goes above the MA the market expectation should be an uptrend and vice versa but this does not work always as there may be short bulls and bears and also fakeouts which may not be captured by the MA and this may cause losses on the side of a beginner if care is not taken.
Finally, since there is no perfect indicator that has the sole capacity in predicting future prices or possibly being used alone, the need to use this indicator with other indicators for efficient and effective maximization of profit. Thanks to Professor @shemul21 for helping me to add this knowledge to my trading archive.
Cc: @shemul21
Hello @steemcurator02 Good day. I wish to inform you that my homework is 6days old already. It has been marked but not yet upvoted. Thanks