Crypto Academy / Season 3 / Week 2 - Homework Post for Prof @cryptokraze /Market Structure Break (MSB) Strategy to trade reversal
1 - What do you understand about Market Structure?
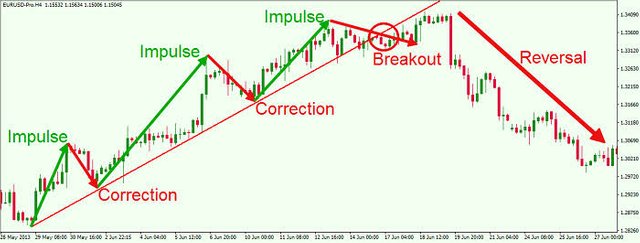
Market structure is a kind of repeated movement a the price of an asset makes in an uptrend, downtrend or sideways movement. Price movement in cryptocurrency follow a particular pattern which is very necessary to understand for every crypto trader. Price does not go up straight in an uptrend but a period high and low makes up a bullish run. So also, price do not just go straight down in a downtrend but a period of down and high makes up a downtrend. This makes a ziz-zag movement in price in either uptrend or a downtrend. This movement pattern is a characteristic of any direction the price moves per time.
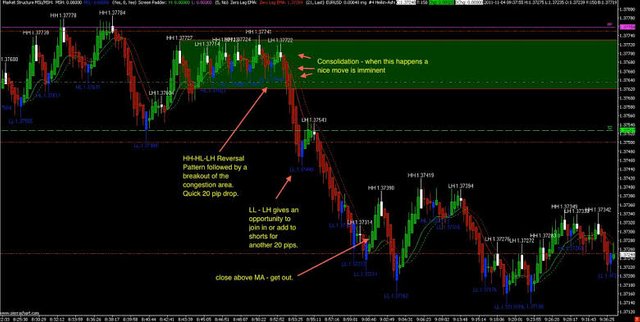
2 - What do you understand about Lower High and Higher Low? Give Chart Examples from Crypto Assets.
.jpeg)
source
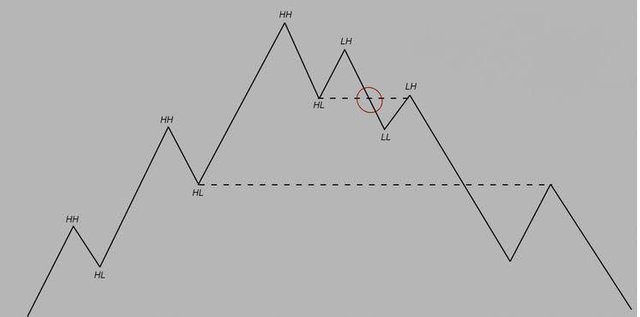
In an uptrend where the price of a crypto asset attains the highest price in a period of time and after a while, the price begins to fall, it falls for some time and starts going up again going close to the highest it falls back. That point it it reaches before it starts falling back is the point called lower higher. A wise trader who could not sell at the highest point can take advantage of this opportunity to sell because this point is high, just that it is a bit lower than the highest point. Very likely, a downtrend would start to occur once the price fall from price it reaches at lower high. The Lower is the point in an uptrend that is lower than the highest point marked in a the most recent uptrend
A downtrend at a point marked as the lowest at a particular period would start to go up continuously with about two bull candles for a period. This movement reverses and another downtrend resumes. This downtrend goes very close to the to the lowest point but reverses back. The point from where it reverses, and starts doing up is what is called higher low. This happens as no downtrend will continue forever, there is always going to be a swing in price at some point. The higher low is therefore a point in the downtrend higher than the lowest point marked previously.
3 - How will you identify Trend Reversal early using Market Structure Break? (Screenshots Needed)
The identification of the of trend reversal in crypto asset movement in price is quite easy. Whether it be an uptrend or a downtrend, the reversal point cab be identified. To be able to do this effectively, three points in the price chart and candlesticks charts have to be noted.
This points are:
- Formation of Lower high at top of an uptrend
- Marking the Neckline of Market Structure
- Waiting for the clear break of Neckline
When this points have been ascertained in a chart, the reverse trend can easily be determined and a decision can be taken.
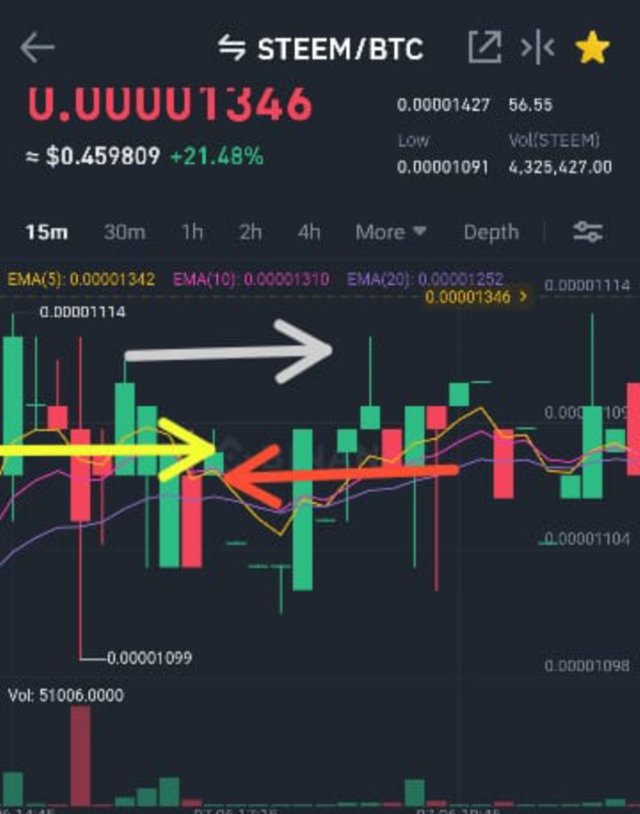
In the screenshot, the white line arrow is used to represent lower high, the yellow line arrow is used to represent neckline market structure and the red line arrow is used to represent break in neckline
source
In an uptrend, where the lower her point has been marked and the declined in price continues for a while after some times, it goes up a again but drops without even getting close to the lower high. There will be a sideways movement in price at that point and before you know it, the price drops. Before this drop in price, a point called the neckline of market structure has been drawn from left to right. The drop in price below the neckline of market structure is the when an actual downtrend starts and this is called the reversal trends. This may continue for a period of time, so a wise trader would have to watch and see where it reaches.
.png)
source
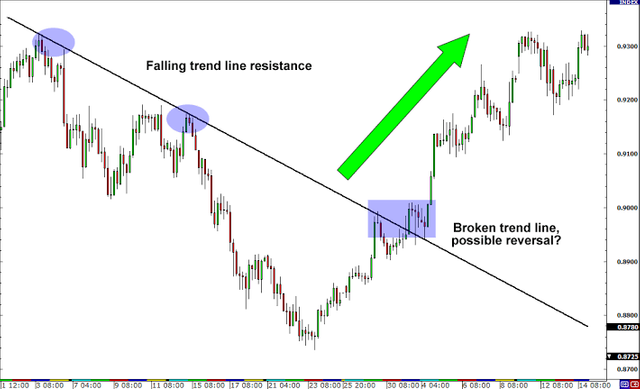
In the same vain, in a downtrend where price reaches a higher low, after a period of swing and sideways movements which creates a neckline of market structure from left to right of the chart. After a period, this neckline of market structure is broken and an uptrend begins. From the point where the neckline market structure breaks, an uptrend starts and will continue for as long as possible.
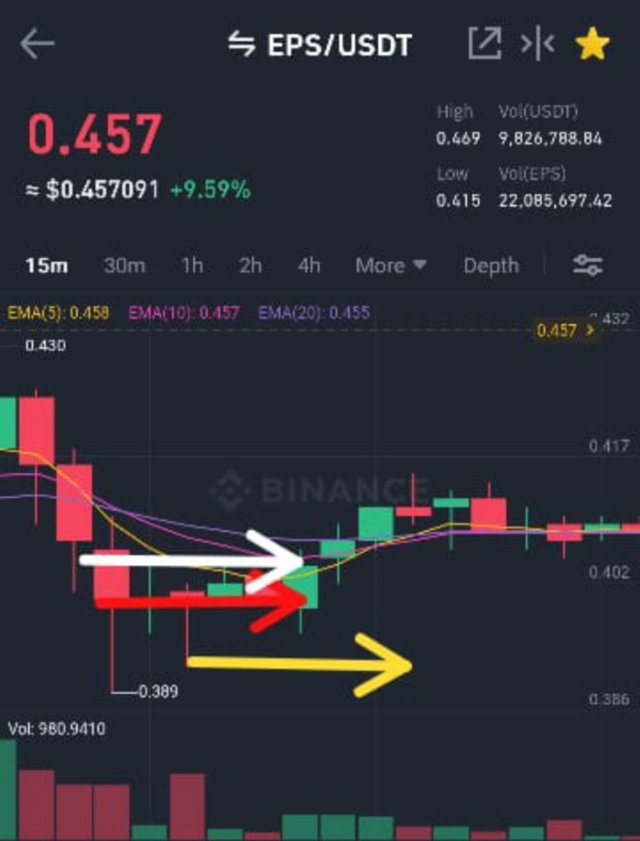
In the screenshot, the yellow line arrow is used to represent higher, the red line arrow is used to represent neckline market structure and the white line arrow is used to represent break in neckline
4 - Explain Trade Entry and Exit Criteria on any Crypto Asset using any time frame of your choice (Screenshots Needed)
The entry and exit criteria can successfully be applied when an understanding of market structure has been ascertained. There are certain entru and exit criteria one must follow, going into the market. This criteria are explained in the entry and exit criteria for the two crypto asset used.
One has to know when to buy and when to sell in order to buy at the lowest of prices and sell making considerable amount of profits. I am going to use the screenshots already used above to explain this point.
The Entry Criteria
The market should be entered in a downtrend.

The crypto asset used above is ellipsis, the EPS/USDT pair with a time frame of 15minutes. The crypto asset from the above picture is in a downtrend.
From the higher low which is represented with a yellow arrow line, a person who wants to buy is in a good time to enter the market. Nevertheless, one has to be sure, so one has to wait and confirm a neckline structure and later see that the neckline structure represented by the red arrow has been broken, the white arrow line shows that. This means that the crypto asset is no more in a downtrend but ready to move up. At this point, a trader can set a buy option a little above the break in neckline so that the asset do not move in a rush when the trader has not bought.
This is not to say that one cannot buy at a point very close to the lower low point of the asset but it would be a rushed decision to buy and see the asset further dumpling. So it is just advisable to observe and be sure of the market structure before making a buy option.
The Exit Criteria
The market should be exited in an uptrend where a considerable gain has been made in an asset.

The above image is used is Steem crypto asset in the same time frame of 15minutes. STEEM/BTC trading pair was used. From the Lower high position that is assigned the white arrow, a person who missed out of the higher high should make decisions on sell because once the asset breaks the neckline market structure marked with the yellow arrow, one would feel bad about selling low. From the break in the neckline structure marked with red arrow, the fall may be drastic. So once one sights the break in line structure, it would be cool to sell at the market price a observe the market.
Though it is possible to sell at a point very close to the higher high, since one cannot predict the next price action, it would just be cool to observe and be sure of what would happen next.
5 - Place 2 demo trades on crypto assets using Market Structure Break Strategy. You can use lower timeframe for these demo trades (Screenshots Needed)
A sell trade of Steem/Btc
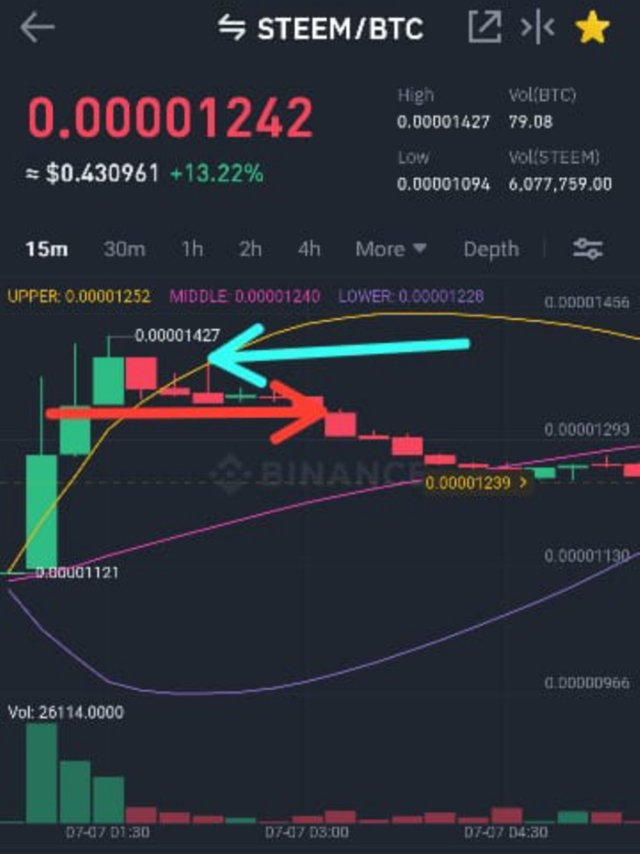
The light green arrow represents the lower high while the red arrow represents the neckline of market strategy.
I made my sale around the lower high position of the price before the break in neckline of market strategy.
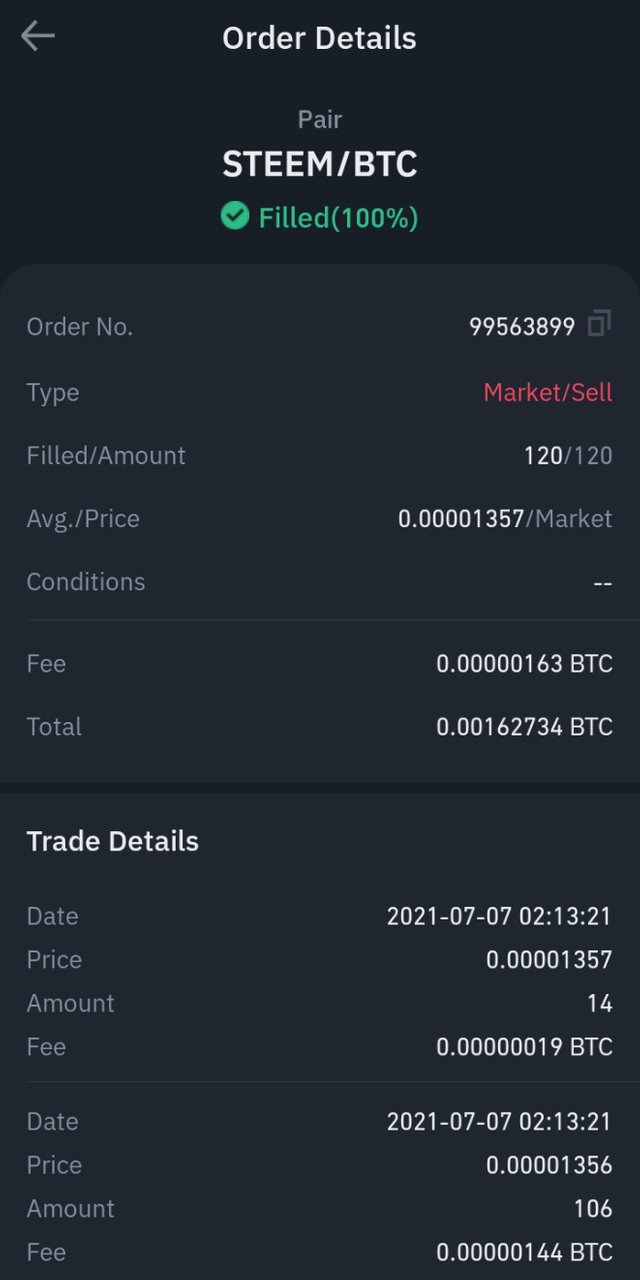
This is the details of the steem/btc trade I made
A second trade from the same Steem/Btc Pair.
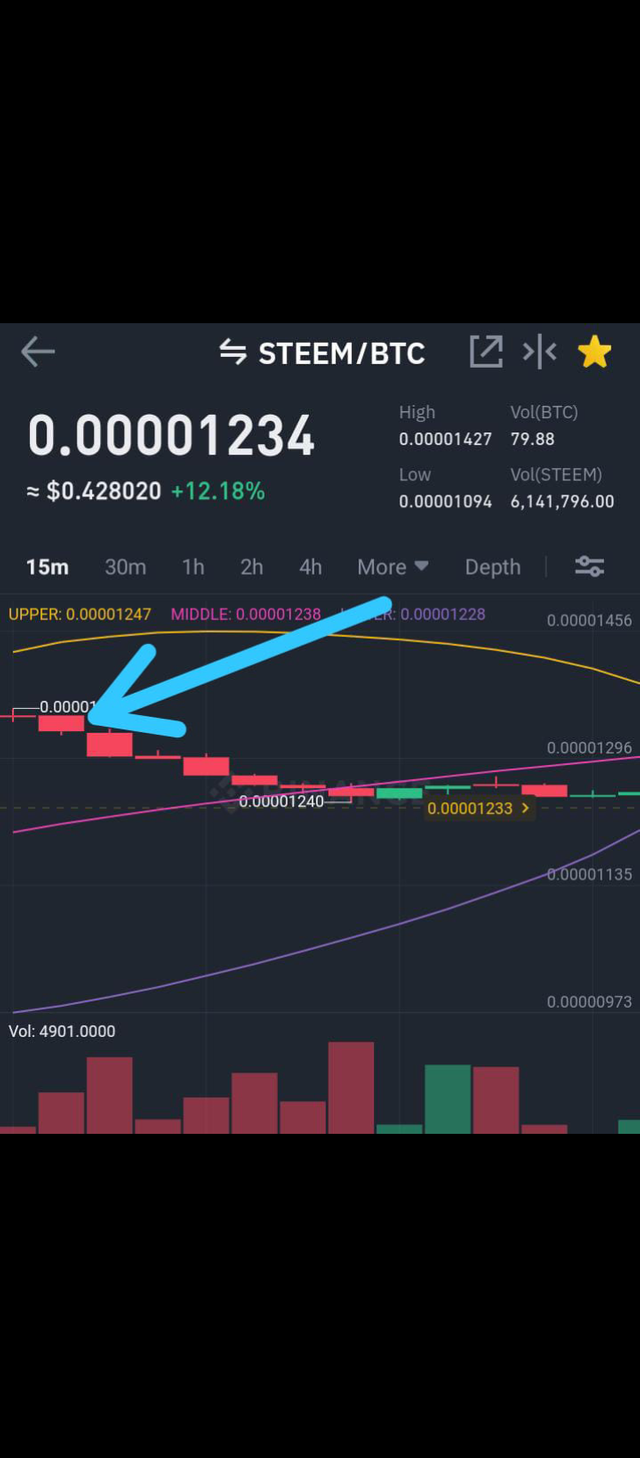
I bought from the point from around the arrow, waited for a while and when the price went up a little, I sold.
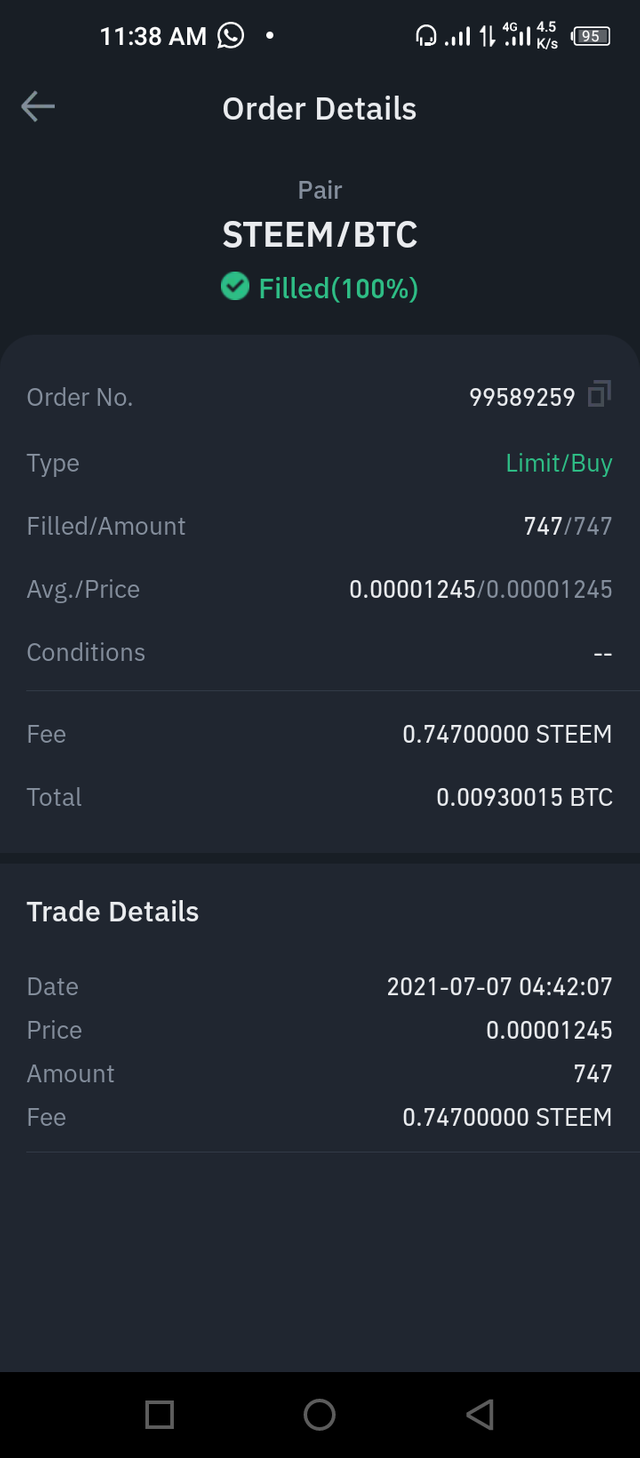
See details of the transaction above.
Conclusion
Market Structure Brea strategy is a method for deciding the best time to enter or exit a trade. It is an alternative measure to use instead of technical indicators. Market Structure is simply price movement pattern in a chart. Price do not just go straight up or down, it takes a zig-zag walk as it moves up or down. A knowledge of significant points marked in price movement and the pattern it takes every time it makes similar movements can help on decide on when it is best to buy and sell for needed profits.
This is my entry!
Cc:
@steemitblog
@cryptokraze
@kouba01
.jpeg)
.jpeg)