Crypto Academy Season 3 Week 6 Homework Post for (@asaj) Vortex Indicator Strategy
The professor explained the Vortex indicator in fine detail this week. I read the professor's course paper. I asked the professor questions about the subjects I did not understand. He answered these questions immediately. Thanks to him for everything.
Now I am writing my homework.

1.) In your own words explain the vortex indicator and how it is calculated
It is a trend indicator inspired by the natural sciences by two expert analysts, Etienne Botes and Douglas Seipman. It was introduced in a magazine in 2010. It builds on the previous work of renowned market analyst J. Welles Wilder. Analysts developed the indicator by monitoring the movement of waves that occur on the water surface. The Vortex indicator consists of two lines showing trend movements. These are the positive (VI+) and negative (VI-) lines.
It is used by traders to detect the start of a trend and confirm current trends. It is quite simple to use.
If the VI+ line crosses the VI- line from the bottom up, it indicates a bullish start. Therefore, a buy signal is formed.
If the VI- line crosses the VI+ line from the bottom up, it indicates the beginning of a decline. Therefore, a sell signal is formed.

(Tradingview KAVA/USDT 1D chart)
Generally, the blue line (VI+) in the Vortex indicator denotes the positive line. The red line represents the negative line.
As you can see in the screenshot, the VI+ and VI- lines cross each other many times in different periods and in different ways.
Things to Know About the Vortex Indicator;
- Opening the distance between the VI+ and VI- lines gives information about the strength of the trend.
- Buy or sell signals are captured by the intersection of the VI+ and VI- lines.
- The fact that the VI+ and VI- lines are very close to each other shows the indecision in the market.
- If we use the Vortex indicator with other indicators, it allows us to get more effective results. It is generally recommended to be used with the MACD indicator. Because the MACD indicator is also a trend follower indicator.
How the Vortex Indicator Is Calculated
We can do the calculation in the Vortex indicator by dividing it into several steps.
1) Actual range calculation (TR): It is calculated by subtracting the lowest available value from the highest available value. The previous close is then subtracted from the current lowest and current highest.
Actual value > current high - current low
Actual value > current high - previous close
Actual value > current low - previous close
2) Determining the direction of the trend: The distance between the current high and the previous low represents the upward trend. On the contrary, the distance between the current low and the previous high shows the downward trend. A greater length will occur in strong bullish and bearish trends. The distance on weaker trends will be shorter.
3) Selecting the parameter length: Usually 14 is selected as the length. Like 14 minutes, 14 hours, 14 days and 14 weeks. The range used by indicator creator J Welles Wilder is 14. It has been found that this range gives better results. It is known that it is more effective to use 7-period periods in some periods and 28-period periods in some cases.
In periods of high market volatility, the Vortex indicator may produce false signals, as in other indicators. There are several methods to reduce these signals. Increasing the number of periods used in the indicator. It's like using 28 instead of 14.

2) Is the vortex indicator reliable? Explain
As with all indicators in the market, the Vortex indicator is not a very reliable indicator. If the indicators were very reliable I guess no trader would have lost. Indicators cannot predict how much Bitcoin price will be tomorrow. It can only get an idea of the direction of the trend by analyzing the past price change.
Increasing the reliability of the indicator also depends on the trader. He should know how to use it in normal times or when the market volatility is high.
In normal periods, setting the period to 14 gives better results. Increasing the number of periods during periods of high market volatility increases the reliability of the indicator.
We can see the signals more clearly on the 1-day charts. When we reduce the timeframe on the chart, we need to decrease the number of periods. For example, on 1-hour charts, we can set the period to 7.
The Vortex indicator is used to identify trend reversal and confirm current trends. We know that in some cases it gives deviations and erroneous signals. To avoid this, using it with other indicators (like MACD) will reduce false signals.

(Tradingview ETH/USDT 4H chart)
At the point I marked on the chart, ETH has risen from around $1750 to around $2150. The MACD is the first to give the buy signal. Then Vortex starts giving the buy signal. The Vortex indicator gives the buy signal with a full 8 hours delay. In order not to buy your purchases at a higher price, it is necessary to use the MACD indicator while using the Vortex indicator.

(Tradingview ETH/USDT 1D chart)
The MACD indicator is signaling that there will be a drop in ETH on May 15. The Vortex indicator gives the bearish signal on May 18. A signal with a delay of 3 days.
The vortex indicator is a very recently created indicator. It is not very popular yet, but I can say that it will be very useful when installed correctly. Using Vortex alone would be a wrong choice.
3.) How is the vortex indicator added to a chart and what are the recommended parameters? (Screenshot required)
I will use Tradingview to apply the Vortex indicator on the chart.
First, I logged into Tradingview.com. Then I opened any cryptocurrency pair. Let this be Steem /USDT.

- Then I clicked where it says "fx".

- I typed "Vortex" into the search field and clicked on the first search result.

- As you can see in the screenshot, I applied the Vortex indicator to the chart.

- You can also adjust the graphic time setting by clicking on the place I marked. I set it to be a 1-day chart.

- Just above the indicator, where I marked, there is the settings tab. Click on it.

There are 3 sections in this section: inputs, style and visibility.
First I will set the inputs. Generally, it is set to 14 periods. We have to set the indicator time frame to be the same as the chart.

- In the style settings, positive VI is usually set to blue, negative VI to red. Sensitivity is set by default.
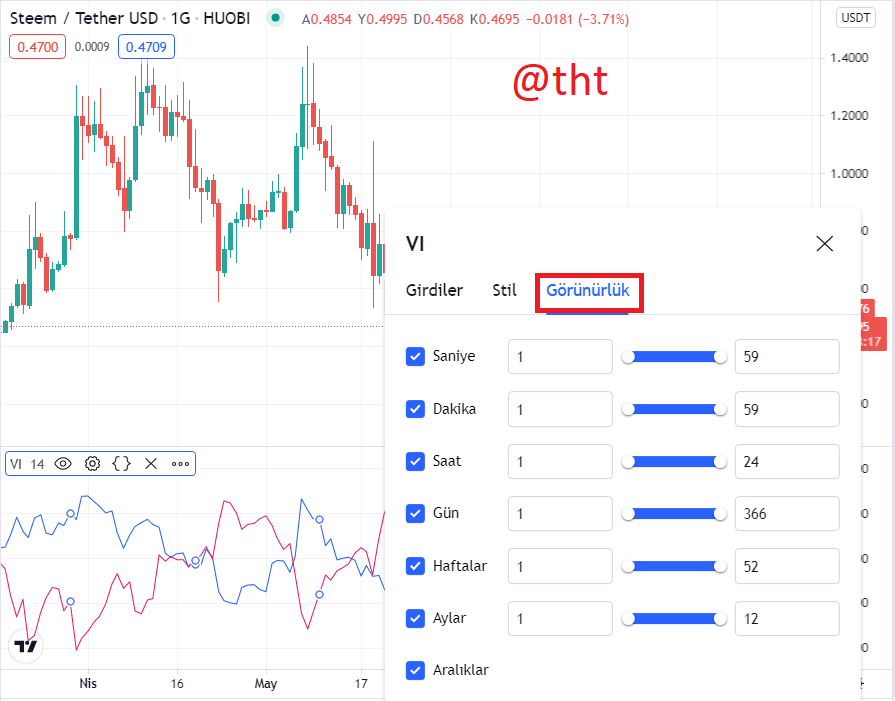
- In the visibility section, the settings should be as in the screenshot. I accepted the visibility as default.
What are the recommended parameters?
Usually 14 consecutive periods are accepted. It could be 14 seconds, 14 minutes, 14 days, 14 weeks, 14 months. More effective results were obtained in longer periods. Instead of 14, some traders used 25 and 28 or even 30.
The determination of the periods is entirely left to the discretion of the traders. But it is always important to find the right periods. It has been determined that faster signals will be received when we reduce the period from 14 to 7. Of course, not all received signals will be correct. Therefore, it will always be in our favor to keep the period long. Especially during periods of high price fluctuations, we may receive too many false signals.
Generally, fast-moving cryptocurrencies respond better to short-term periods. On the other hand, slow-moving cryptocurrencies respond better to long-term periods.
4.) Explain in your own words the concept of vortex indicator divergence with examples. (Screenshot required)
As with other indicators, there are deviations in the Vortex indicator. There are two divergences, an uptrend and a downtrend.
I will now show on graphs how these deviations occur.
Bearish Divergence

(tradingview BTC/USDT 1D chart)
I urge you to carefully examine the chart. Although the Bitcoin price is on the rise, the VI+ line shows a downward trend. This is because the VI+ line has crossed previous resistance levels. In this case, a sell signal emerges. However, the Bitcoin price is rising. So there is a deviation here.
Bullishh Divergence

(tradingview BTC/USDT 1H chart)
There is a decrease in Bitcoin price in the region I marked on the chart. The VI-line then moves downwards instead of upwards. At the same time, if you look carefully, the VI+ line is moving down. There is a mismatch or a deviation here.
If the VI- line was moving down, the VI+ line should have been moving up. The downward movement of the VI- line on this chart is incorrect. It is correct for the VI+ line to move down. Because there has been a decrease in the price of Bitcoin.
A bullish divergence has occurred on this chart.
How Can We Avoid?

(tradingview BTC/USDT 1D chart)
The chart has a bearish divergence. The Vortex indicator is not in line with BTC price. However, when I apply the MACD indicator to the chart, no divergence occurs. The MACD indicator moves in line with the price.
Therefore, it is essential to use the Vortex indicator and the MACD indicator together to avoid such divergences.
5) Use the signals of VI to buy and sell any two cryptocurrencies. (Screenshot required)
I got buy signals on CMT and LOL cryptocurrencies. Then, after waiting for a while, sell signals appeared. Since there was a position that I would profit from, I carried out the sales transactions.
CMT Buy signal:

(tradingview CMT/USDT 5minutes chart)

I caught a buy signal on the CMT/USDT 5-minute chart. The VI positive line crosses the VI negative line from bottom to top. This is a buy signal. I bought 7.10 USDT worth of CMT.
CMT Sell signal:
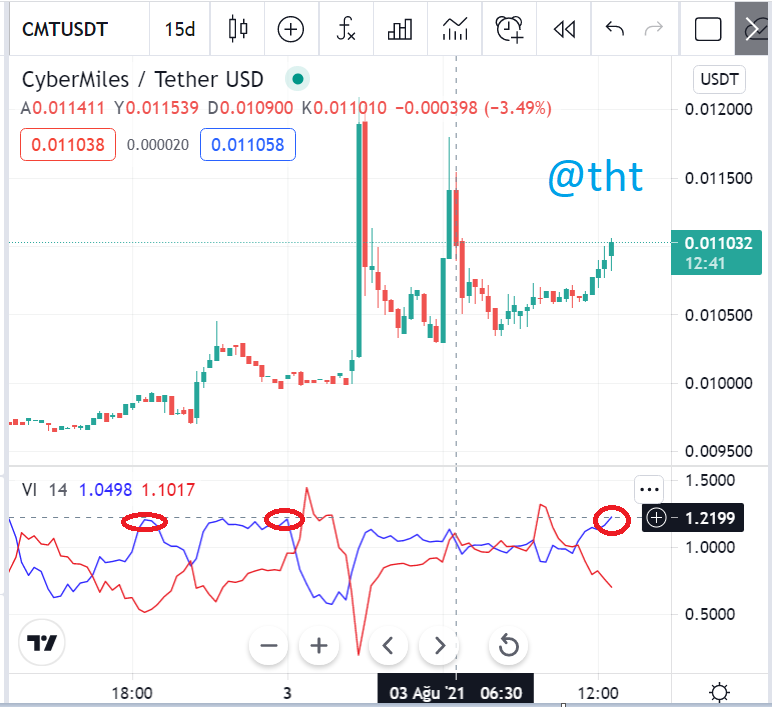
(tradingview CMT/USDT 15minutes chart)

I learned the strategy of getting a sell signal by asking the professor a question. I think this is a sensible and effective method.
On the Vortex indicator, I drew a resistance line at the highest points of the VI+ trendline. When the blue line reaches this level, I executed the sale.
I bought 673 CMTs for $7.10. Then I sold them for $7.30. I made a total profit of $0.20. If we also calculate the commission I paid on the exchange, I made more profit at $0.20.

After closing the sell transaction, the CMT price dropped drastically. You can also see this in the chart.
LOL Buy Signal:

(tradingview LOL/USDT 30minutes chart)

As you can see in the LOL/USDT chart, there are many buy signals. Buy signals occur when the VI+ line crosses the VI+ line from the bottom up. I wanted to evaluate this buy signal right away. I bought LOL at 0.000297$. It is risky to make purchases in the periods when the VI+ and VI- lines are very close to each other. However, I found it worth taking the risk.
LOL Sell Signal:

(tradingview LOL/USDT 30minutes chart)
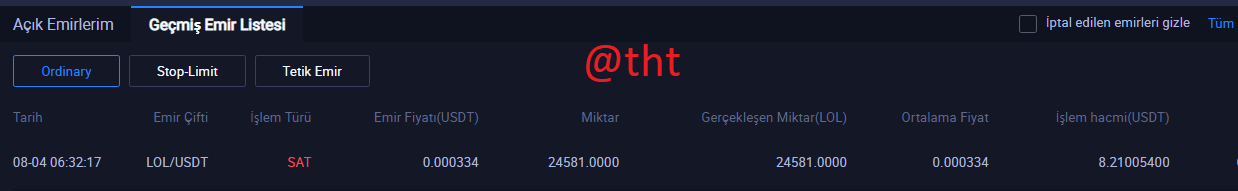
I bought LOL for $0.000297. I paid $7.30. I made enough profit when LOL price went up to 0.000334$. I sold my LOL tokens for $8.21. I made a profit of about 0.90$.
It is possible to see many sell signals on the chart. A sell signal occurs when the VI- line crosses the VI+ line from bottom to top. However, I followed a different strategy here. This strategy is much more profitable than the current strategy. I draw a line from the highest levels of the VI+ lines. A resistance level is formed here. When the VI+ line reaches these levels, a sell signal occurs.
Conclusion
The Vortex indicator is an indicator that is used to detect trends and confirm the current trend. Although it is still a very new indicator, it is used by many traders. As with other indicators, using the Vortex indicator alone is quite risky. Sometimes it gives delayed signals. It will be very useful when used in conjunction with the MACD indicator.
Apart from that, it is also important to set the indicator correctly. It takes some practice before trading.
Cc:
@steemitblog
@asaj
Twitter sharing
https://twitter.com/Steemtht/status/1422805849521762305