Steemit Crypto Academy –Season 2 Week 7 Post for proffesor @yohan2on
I am doing the homework given by Professor @yohan2on
Swing trade
Swing trading has been described as a kind of fundamental trading in which positions are held for longer than a single day. Most fundamentalists are swing traders since changes in corporate fundamentals generally require several days or even a week to cause sufficient price movement to render a reasonable profit.
1:-The Crypto Asset Pair
In cryptocurrency, “trading pairs” or “cryptocurrency pairs” are assets that can be traded for each other on an exchange — for example Bitcoin/Litecoin (BTC/LTC) and Ethereum/Bitcoin Cash (ETH/BCH). Trading pairs lets you compare costs between different cryptocurrencies.
2:-What's my Entry and exit strategy?
My entry in crypto the price is going down, i am purchase the Crypto and when the price going up on high their price i am sell all assets and go exit.
3:-Multiple time frame analysis.
Multiple time-frame analysis involves monitoring the same currency pair across different frequencies (or time compressions). While there is no real limit as to how many frequencies can be monitored or which specific ones to choose, there are general guidelines that most practitioners will follow.
Typically, using three different periods gives a broad enough reading on the market, while using fewer than this can result in a considerable loss of data, and using more typically provides redundant analysis. When choosing the three time frequencies, a simple strategy can be to follow a "rule of four." This means that a medium-term period should first be determined and it should represent a standard as to how long the average trade is held. From there, a shorter term time frame should be chosen and it should be at least one-fourth the intermediate period (for example, a 15-minute chart for the short-term time frame and 60-minute chart for the medium or intermediate time frame). Through the same calculation, the long-term time frame should be at least four times greater than the intermediate one (so, keeping with the previous example, the 240-minute or four-hour chart would round out the three time frequencies).
Weekly Time-frame Chart
this will help me understand the entire price history of the coin including the overall trend.
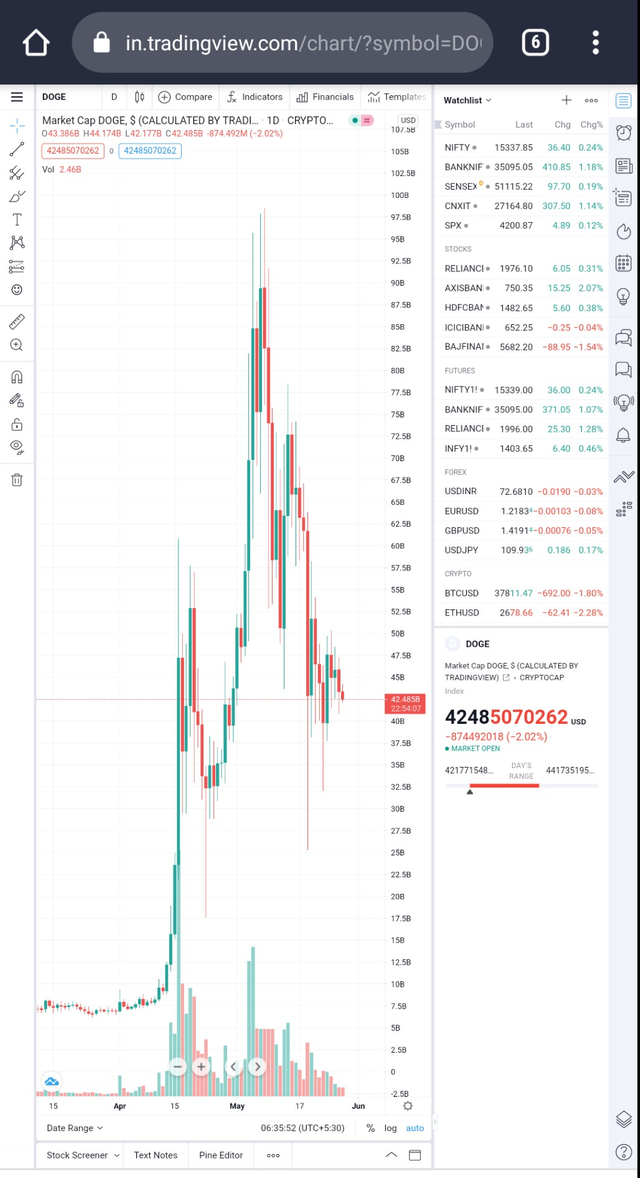
As you can see in the chart, coin has seen a gradual rise over a period of time, it has experienced a downward trend. It is very easy to identify if the whole graph is visible.
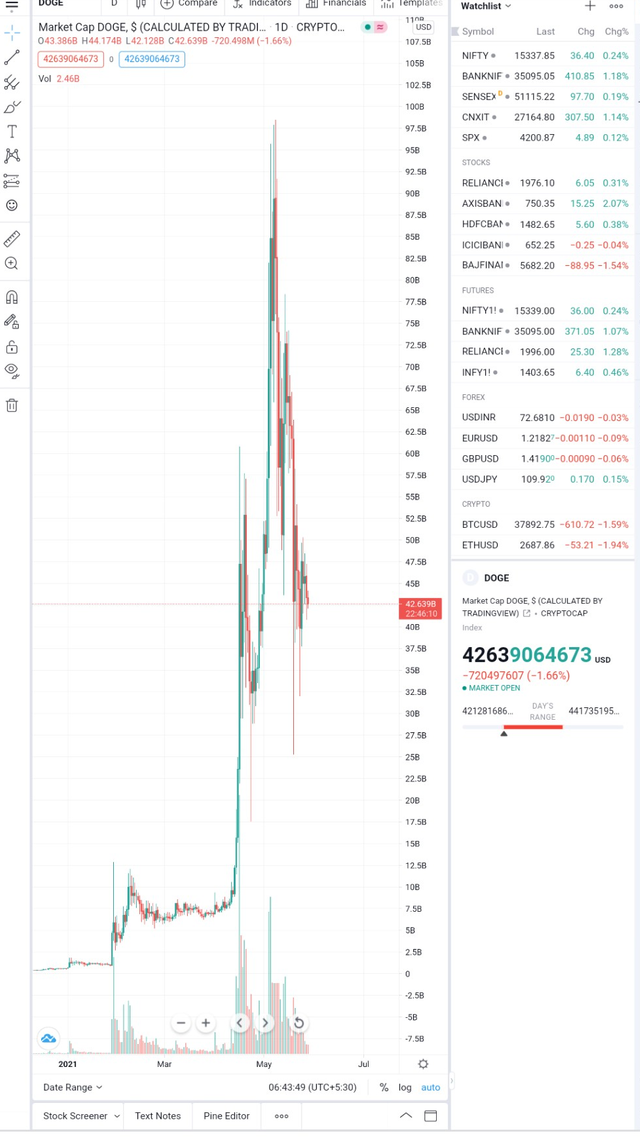
Daily time-frame chart
This is a more detailed chart showing the waves from the chart. A day chart is shown in a daily manner, where a bar or cadlist represents a day.
4:-Candlestick analysis and use of other relevant supporting indicators for your trade decision.
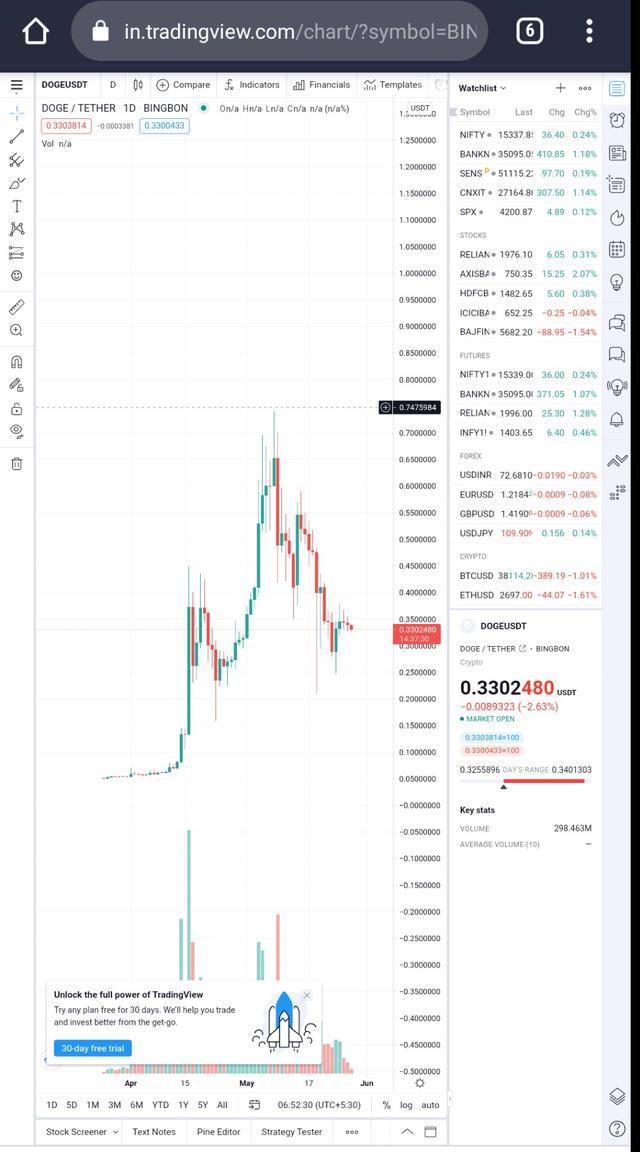
You will be seeing this graph. The red line in the middle is the trading line.The top line which is the black line is the all time high line.Right now the market is on very ups and downs.
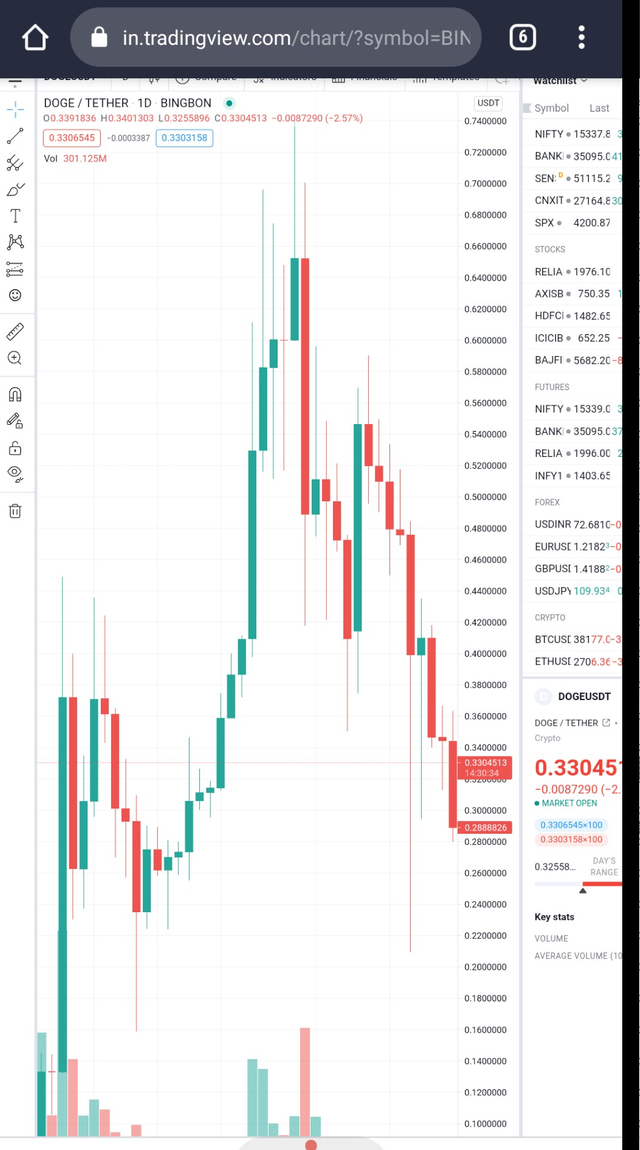
In this graph, you can see how much the flame has gone.And how much is going on right now.
5:-Trade management ( Setting stop loss, trailing stop and take profit)
When combining traditional stop-losses with trailing stops, it's important to calculate your maximum risk tolerance. For example, you could set a stop-loss at 2% below the current stock price and the trailing stop at 2.5% below the current stock price.
Conclusion
So yeah that was it, I hope I covered everything the professor asked for. And if @yohan2on you found is missing or I didn't tell it correctly, so you're the professor you have the right to correct me hehe. Will keep an eye on the next wonderful lecture.
Hi @thisisrishu
Thanks for participating in the Steemit Crypto Academy
Feedback
This is poorly done. You did not demonstrate your understanding of Swing trading. You had to take time and understand what it is then come and present your work. You had no clear trading plan. No technical analysis. No trade management.
Homework task
1.5
Hello professor @yohan2on
Please check my homework