Crypto Academy Week 16 Homework Post for Professor @Fendit
Homework for this lecture:
Share your understanding on "Composite Man" and the fundamental laws. What's your point of view on them?
Share a chart of any cryptocurrency of your choice (BTC or ETH won't be taken into account for this work) and analyze it by applying this method. Show clearly the different phases, how the volume changes and give detail of what you're seeing.
1 Share your understanding on "Composite Man" and the fundamental laws. What's your point of view on them?
Composite Man
The mixed person will become a hypothetical representation of the market which we as investors represent and imagine that this market is being controlled by one person and not by their group, this will help us to understand the different phases. Experience the market, and thus be able to have a clear idea of how the market will react to future movements, whether bullish or bearish.
This representation, as in one, follows a series of patterns that are identifiable to the volume depicted in the graph, and thanks to the Wyckoff method, these patterns will help us get the most out of our investments, Because we can predict the movement of the market, and follow in the footsteps of this great investor whom we recognize as "The Composite Man".
We are all familiar with the term whale in the trade, (not exactly a majestic marine mammal) but a person or financial institution that eats vast (and majestic) wealth, whose entry and exit operations shake the market like a whale stirs the waters of a pond. Why? We can think of the "composite man" as the sum of all the whales in a single identity.
Accumulation
It is presented through the end of an up or down trend line, which allows investors with large amounts of money to place orders at a very attractive price, causing its value to rise slightly and then fall. And by orders, called support, entry a range for a certain amount of time, which allows for a very attractive area for many investors and they are forced to invest in that range, thereby increasing in value. it occurs. (This can be seen as the opposite of trend-wise).
Distribution
Here people start selling because they think the price has gone up and it creates an oscillating range as they take advantage of new investors and put small amounts for sale, these people who sell are the ones who have accumulated Bought in phase. mixed man.
Down/Downward Trend in Price:
When the aggregate has already achieved its mission, accumulators sell large amounts to reverse the trend of the pattern and drop in asset prices, which creates a fear for new or new investors and those who want Anything they do they are forced to sell short so that the overall person eventually closes his steps and he buys again at those low points to start afresh the 4 steps of the overall person.
2 Share a chart of any cryptocurrency of your choice (BTC or ETH won't be taken into account for this work) and analyze it by applying this method. Show clearly the different phases, how the volume changes and give detail of what you're seeing.
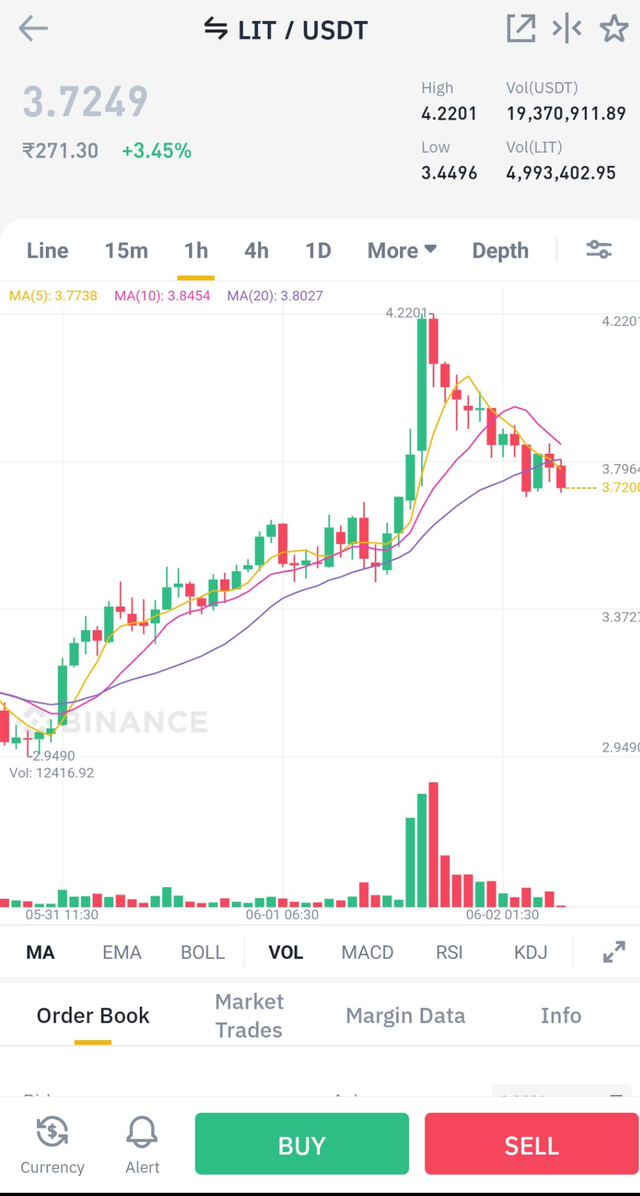
The currency used was Litecoin, an accumulation can be seen in the graph, and although not much volume is seen in the beginning, the first phase of the Wickoff method begins, the process has already started, presenting the first uptrend. Although this one has been so slight, the increase in volume is noticeable at the point when the accumulation ends and the upward trend begins, and this process is again evident in the scenario in which the first uptrend The side trend ends and the revaluation begins, this is where there is a second upward trend, in which price and volume have increased significantly, to the point that is convenient for the individual as a whole, while presenting its highest level. , the distribution process begins as the price has reached its peak, this process occurs over a long period of time until large investors have exited all their assets and amassed large profits, thus giving way to the start of the trend. . A slight bearish, however, in the graph does not indicate that a phase of redistribution may be appreciated so that the curve continues in a downward trend and a downtrend is observed and the method is complete.
Conclusion.
To conclude, it can be said that the Wyckoff method is one of the most important analysis that a novice in the trading world should understand, because the people who control the market always apply the same strategy, some experienced For people who make great profits when they enter the business world, these inexperienced people almost always fall into the trap of these great investors, and only a few manage to understand what happened to them and they made money. Why lose, that's where the Wyckoff method comes in because he was in charge of studying these behaviors and these cycles, managing to find a strategy in which to follow the movement of big investors and detecting the signals that tell you. When to buy and when to sell.
Hello
@fendit
Pls check my homework
I'm sorry, you don't meet the criteria that was specified by Steemit team to be eligible for a vote. Your SP should be at least 150 and your reputation over 50.