Understanding Trends - Crypto Academy / S5W1- Homework Post for @reminiscence01".

When we consider a behavior of a market price movement for a given time frame, and if it is heading towards the upwards direction by giving higher high, higher low prices or moving towards the downward direction by giving lower low prices we call it as a trending market.
In a nutshell in a trending market, the behavior can be described as either a uptrend or a downtrend. If the market is set to be uptrend, the sellers are in control of the market and the prices will move up and down without crossing the higher low point of the trend. If the market is moving the downward direction the buyers are in control of the market while the prices of the particular commodity will move to the downward direction. So if the prices are closer to the support and resistance levels, we call it as a ranging or a sideways trend.
Bullish trend
For a given time period, when a market price of a respective commodity gives higher highs and higher lows, we call it as a bullish trend. Not only is that, in a bullish trend the market price of a commodity higher than its previous high value. In a bullish run, always the market price of a commodity expected to be rise up .
Bearish trend
Here the users will have to experience a market price down drastically. In a bearish run market makes lower lows and will lead to lower down the market prices. This will mainly happen because of the low demand and high supply situation of some commodities and in a bullish trend situation buyers will take the market into control as well.
2) Explain the following trend identification and give an example of each of them. (Original screenshot needed from your chart). Do this for a bullish and a bearish trend.
i) Market Structure.
ii) Trendlines
i) Market Structure
Market structure will show the current status of the market behavior and will indicate whether the market is moving an uptrend, downtrend or ranging with the use of candlestick chart patterns. In a nutshell this market structure will show the exact time to enter the market and do the buying and selling and exact time to leave the market to minimize the losses.
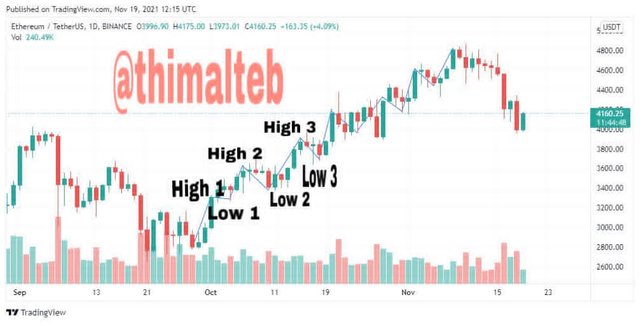
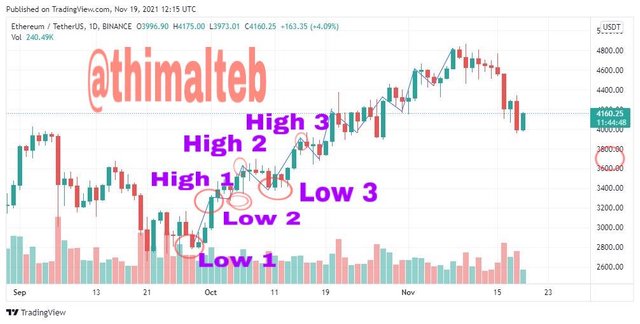
Market structure for a bullish trend
In a Bullish market structure, the market will form higher highs and higher lows. Here the market will not be able to even touch the previous low point on higher lows but it will go higher than the previous high point in higher highs. In a Bullish market structure, this pattern will continue and create opportunities to buy.
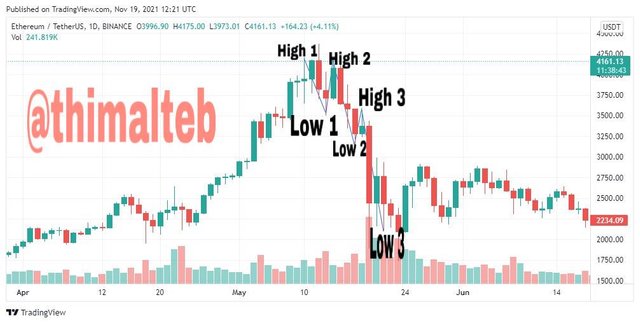
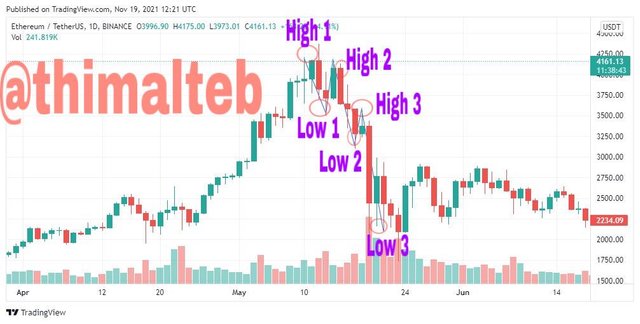
Market structure for a Bearish trend
In a Bearish market structure, the market will form lower-high and lower lows. Here we can see a continuous pattern of market goes and touches the lowest and bounce back and going to pass the previous low point and bounce back again without passing the previous lower high position. Also this structure will create opportunities to sell.
i)Trendline
Trendline can be described as a technical analysis tool which will help to analyze the market price movement. For an uptrend, this can be drawn by using two lower points (higher low)for a downtrend this can be drawn by using two high points (Lower high)
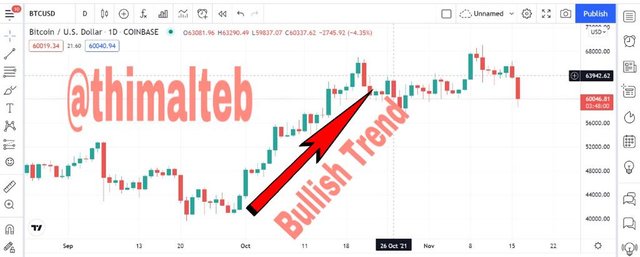
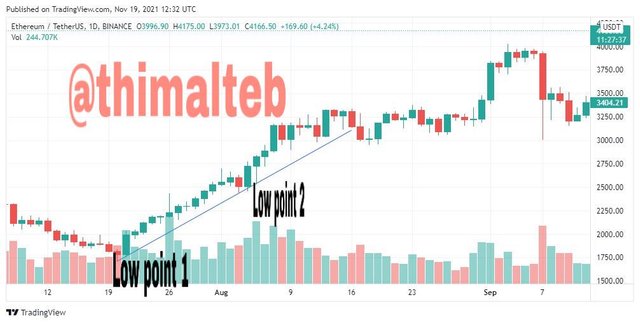
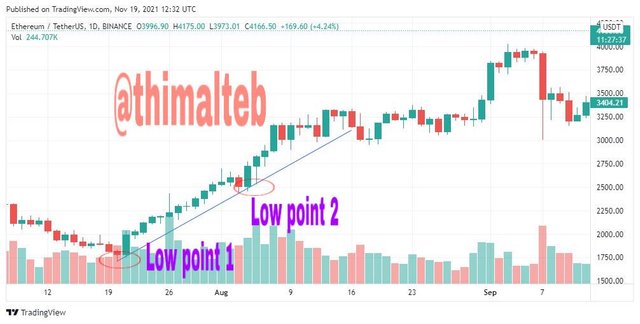
Bullish trendline
After drawing the trendline using highs low points, we can see the price is trading above the trend line for a bullish trend and a bounce back can be seen at every time when the price hit the trendline, This will also indicate the buying option for the traders.
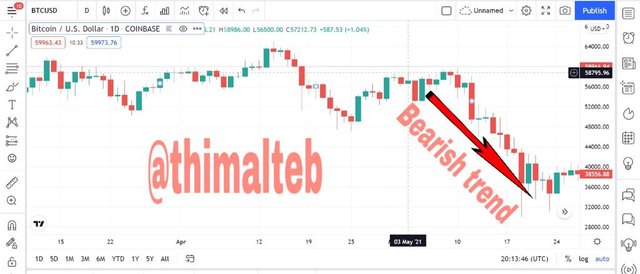
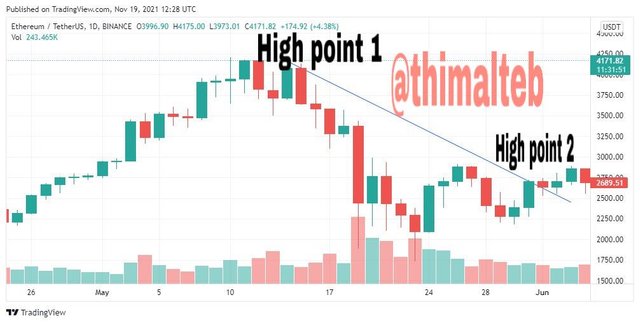
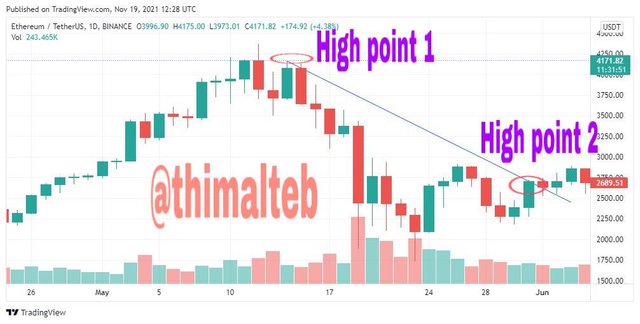
Bearish trendline
After drawing the trendline using Lower high points, we can see the price is trading below the trend line for a bearish trend and here also we can experience a bouncing back to the lower direction whenever the price hits the trend-line. Selling opportunity will be created by these types of trends.
3) Explain trend continuation and how to spot them using market structure and trendlines. (Screenshot needed). Do this for both bullish and bearish trends.
Fluctuating prices and trendline touching prices will give rise to a trend in a market.
Before starting the proceedings, I would like to mention the factors to be concern for a bullish and bearish trend to be happened.
- For a bullish trend to be exist in a particular market, the new high price value should be greater than the previous high price value and the new lower must be greater than the previous low.
- For a bearish trend to be existing in a particular market, the new high price value should be lower than the previous high price value and the new low should be lower than the previous low.
Trend continuation spotting using market structure
When talking about a bullish trend continuation and a bearish trend continuation in a market structure price chart, both these support in a bearish trend and the resistance in a bullish trend should be repeatedly broken for the existence of a trend continuation, because otherwise trend may lead to reversals because of trend weakening.
Trend continuation spotting using Trendline
When talking about a bullish trend and bearish trend continuation in terms of trendline , for a trend continuation to be success; the trend line should not broke. If the trend line could not follow the above clauses, then it may lead to a trend reversal.
4) Pick up any crypto-asset chart and answer the following questions -
i) Is the market trending?
ii) What is the current market trend? (Use the chart to back up your answers).
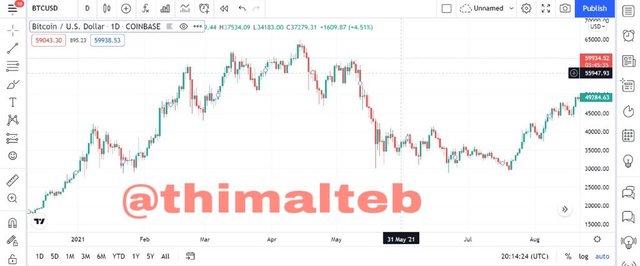
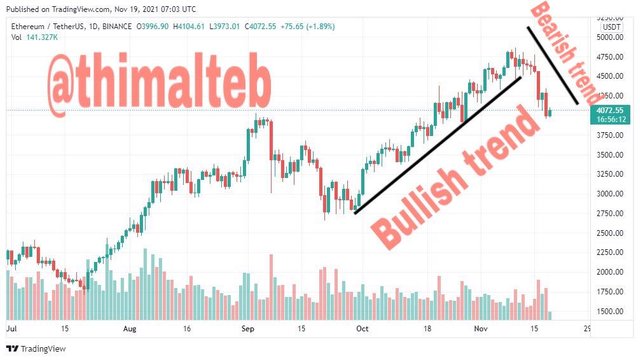
According to the below chart, clearly we can see a trending market throughout. Especially from end of September to around 10th of November, we can see an uptrend while from there onwards up to now there is a downtrend. When considering the uptrend phase, it has higher highs where the every high is higher than the previous high. Also in the uptrend phase there are higher lows which the every low is higher than the previous low.
At the moment we are experiencing a trend reversal and currently the chart has a bearish direction move because the-sellers took the market after the trend breakout.
Most of the time, trading will depend on the market behavior. So because of that, a good understanding on trend is very important thing and it is a must to know about trending markets and ranging markets.
As according to the previous homework’s, we know that using only one technical analysis tool is not a good practice at all. Therefore the results given by one technical analysis tool should be verified by other tools. For this, market structure and trend line understanding will be a huge advantage.
This is the end of season 5 week one homework task 1 and thank you professor @reminiscence01 for this valuable lesson about understanding trends.
Hello @thimalteb , I’m glad you participated in the 1st week Season 5 of the Beginner’s class at the Steemit Crypto Academy. Your grades in this task are as follows:
Observations:
This is not correct. The buyers can't be in control of the market during a downtrend.
Recommendation / Feedback:
Thank you for participating in this homework task.
Thank you very much professor for your feedback!!!