Crypto Academy Week 14 - Homework Post for @fendit

Elliot Wave Theory
Brief Overview
This is a trading tool created by Ralph Nelson Elliot after he made a discovery from analyzing 75years worth of market data. His discovery - stock prices do not move in chaotic manner but in repetitive cycles. These repetitive cycles of market prices were as a result of:
- the emotions of investors which are caused by outside influences and
- trading mass psychology at that time.
Elliot explained that the downward and upward swing of the crypto market prices caused by the collective mass trading psychology always shows up in the same repetitive patterns. And he called this swing—waves. He said if you can know the structure of these waves, then you can correctly predict where the market would go next.
Application of Elliot Wave Theory (EWT)
With the Elliot Wave Theory EWT, traders won't have to see the upward and downward movements of prices in the crypto markets as random or chaotic. Now traders can find order and structure within these price movements.
Entry and exit points
Because of the clear formations derived from the use of Elliot Wave Theory, it gives us a signals as to when to enter the market and when to exit the market. It is a good tool to use because it give us more control in the range of prices that would suit our trading needs with respect to entry and exit of the crypto market and also gives us clues in what to expect out of the market.
Trade management
By employing EMT in our trading operations, we can get clear signals of where the market is headed and when to enter a position. It also enables us to know where to place our stop loss, in an event where the signals turns out to be false or a change in market sentiments.
Something to consider when using this theory:
The price of the market is determined by the movement of the market, this is known as Wave, in the Elliot Wave Theory.
Rules to follow when using the Elliot Wave Theory EWT method.
- The price at which Wave 1 started from should not be surpassed when Wave 2 retracts.
- Wave 3 is usually the longest of the three impulse Waves. Sometimes Wave 1 or Wave 5 can be longer, but both Wave 1 and Wave 5 cannot be longer than Wave 3.
- The price derived from Wave 1 cannot be reached by the retraction of Wave 4 price movement.
In an event where any of these rules are breached, then you have to start counting again.
Steps to take when using the Elliot Wave Theory technique
- Wait for wave 1 to form and start counting. This is because we don't necessarily know when the Elliot Wave technique is in the works, until we start counting.
- After Wave 1 has occurred, you can decide to make a trade in Wave 2 and place your stop-loss just above the price levels of Wave 1 or you can decide to wait for Wave 2 to finish forming.
- Once Wave 2 has ended, you can prepare for Wave 3 by following the rules and counting Wave 1 & 2. When Wave 3 starts you should open a position and place your stop-loss just below Wave 2 price end. Then ride the wave of Wave 3.You can decide to continue these steps for Waves 4 & 5. As well as the corrective wave sequence a-b-c.
Impulse Wave and Corrective Wave
In a trending market the prices move in a 5-3 pattern as described by Mr. Elliot himself. And this 5-3 wave pattern comprises of the first wave known as the Impulse wave and the second wave known as Corrective wave.
Impulse Wave
These are waves that follow the trend, that is, they move in the direction of the trend.
Corrective Wave
These are waves that moves against the trend, that is, they don't move in the direction of the trend. You can also look at it this way, corrective waves are waves that moves in against the current impulse trend.
How to easily spot the difference between Impulse wave and corrective wave
For us to be able to spot impulse wave and corrective wave, we need to have this at the back of our minds that, Impulse waves goes in the direction of the main trend, while corrective waves goes against the direction of the main trend.
That being said we have the 5-3 pattern which derived from a wave sequence. The 5-3 pattern moves in a waves sequence up or down .For the 5 pattern to be complete whether up or down, it must have five waves sequences which includes impulse and corrective waves. After which the 3 pattern would start to form. This 3 pattern is the 3 waves sequence down or up that occurs immediately after the 5 pattern. It signifies that the 5 pattern sequence has elapsed meaning that a change in market conditions and thus direction is imminent.
So naturally for the 5 pattern wave sequence up or down we have impulse wave and corrective wave embedded in them. And for the 3 wave sequence we also have Impulse and corrective wave embedded in them.
The 5-3 patterns which is composed of the 5 pattern wave sequence and 3 pattern wave sequence is together known as the complete Elliot wave cycle.
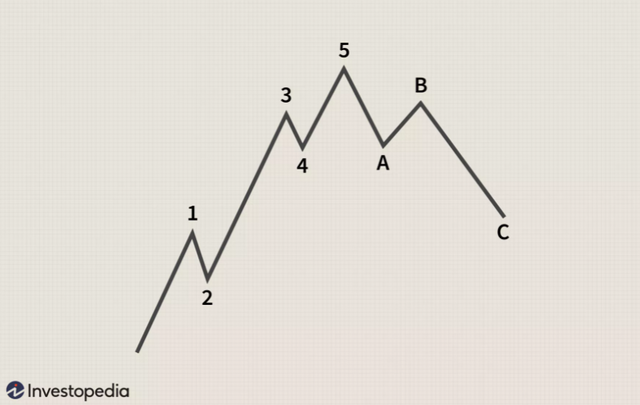
Image 1: Bullish EWT steemit
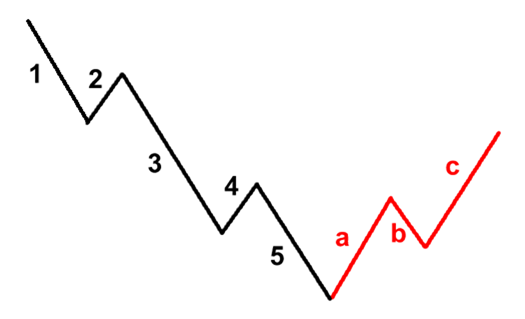
Image 2: Bearish EWT steemit
From Images 1 & 2 above, the 5 pattern comprises of Wave 1 to Wave 5 which is the impulse wave in both the bullish and bearish market, and the 3 pattern comprises of Wave a to Wave c which is the corrective wave in both the bullish and bearish market. Now, within the 5 pattern you also have the impulse wave, that is waves 1, 3, 5 and the corrective wave 2, 4 in both the bullish and bearish market. Same applies to the 3 pattern.
What I think about Elliot Wave Theory as a tool for trading.
I think the Elliot Wave Theory EWT is another form of the Support and Resistance method.
I think so because every waves that occurs both as impulse and corrective waves acts as support and resistance price levels which give traders ideas on how to operate in the market.
For instance when wave 1 occurs, it forms a resistance when wave 2 is about to occur. When wave 2 occurs, it hits a level which now acts as support and an indication that wave three is imminent. Same principles applies to wave 4 and wave 5, all things being equal.
Coin chart example of Elliot Wave Theory
_LI.jpg)
Image 3: BTC/USDT daily chart
This is BTC/USDT chart on the daily timeframe. The green candlesticks are bullish candlesticks which indicates bullish markets, and the red candlesticks are bearish candlesticks which indicates bearish markets.
We can see the Elliot Wave Cycle formation take place.
This is a bullish Elliot wave pattern. The rules regarding the formation of the full cycle of the Elliot waves took precedence.
The 5-3 pattern was very clear to see.
Wave 1 occurred successfully, same as Wave 2 and we can see that the last price point of Wave 2 did not reach the starting point of Wave 1. Wave 3 was also successful and in this cycle, Wave 1 and 3 were the longest. Wave 4 was also successful and by the principles of this trading method, the end price of Wave 4 did not reach or touch the end price of Wave 1.
Wave 5 was also successful, however, Wave 5 had a point where the market 'corrected' before finally completing the Elliot Wave Cycle. So we can look at it as two Wave 5, Wave 5a and Wave 5b.
It is a Wave 5b that the 5 pattern was complete. After which the 3 pattern took place, from Wave a to Wave b, mind you the end price of Wave b did not reach Wave a. Then Wave c to its turn.
As at the time of writing, the market was still moving, but i think Wave c has been formed.
thanks @fendit for this wonderful opportunity to take this exercise
Disregarded as it contains plagiarized content
@sapwood
https://forextradingstrategies4u.com/elliott-wave-theory/
Oh i see Prof @fendit. Would do better work next time.
Thanks for the critical review.
Helpful to know deeper about impulse wave and corrective wave of the Elliot Wave theory. I was thinking that, trading is so simple. But now i can see many of theories and mathematics are linked with it. Its matter of gain more knowledge to be successful in trading. Thanks.
Thank you sir @engrsayful. Most of the trading methods needs some form of theory and mathematics in them in order to get a decent perspective on the market.